Call CA Tally HelpDesk
+91 9205471661,
7428779101
What Changed in 2026: Financial Reporting Needs More Than a Tally Balance Sheet
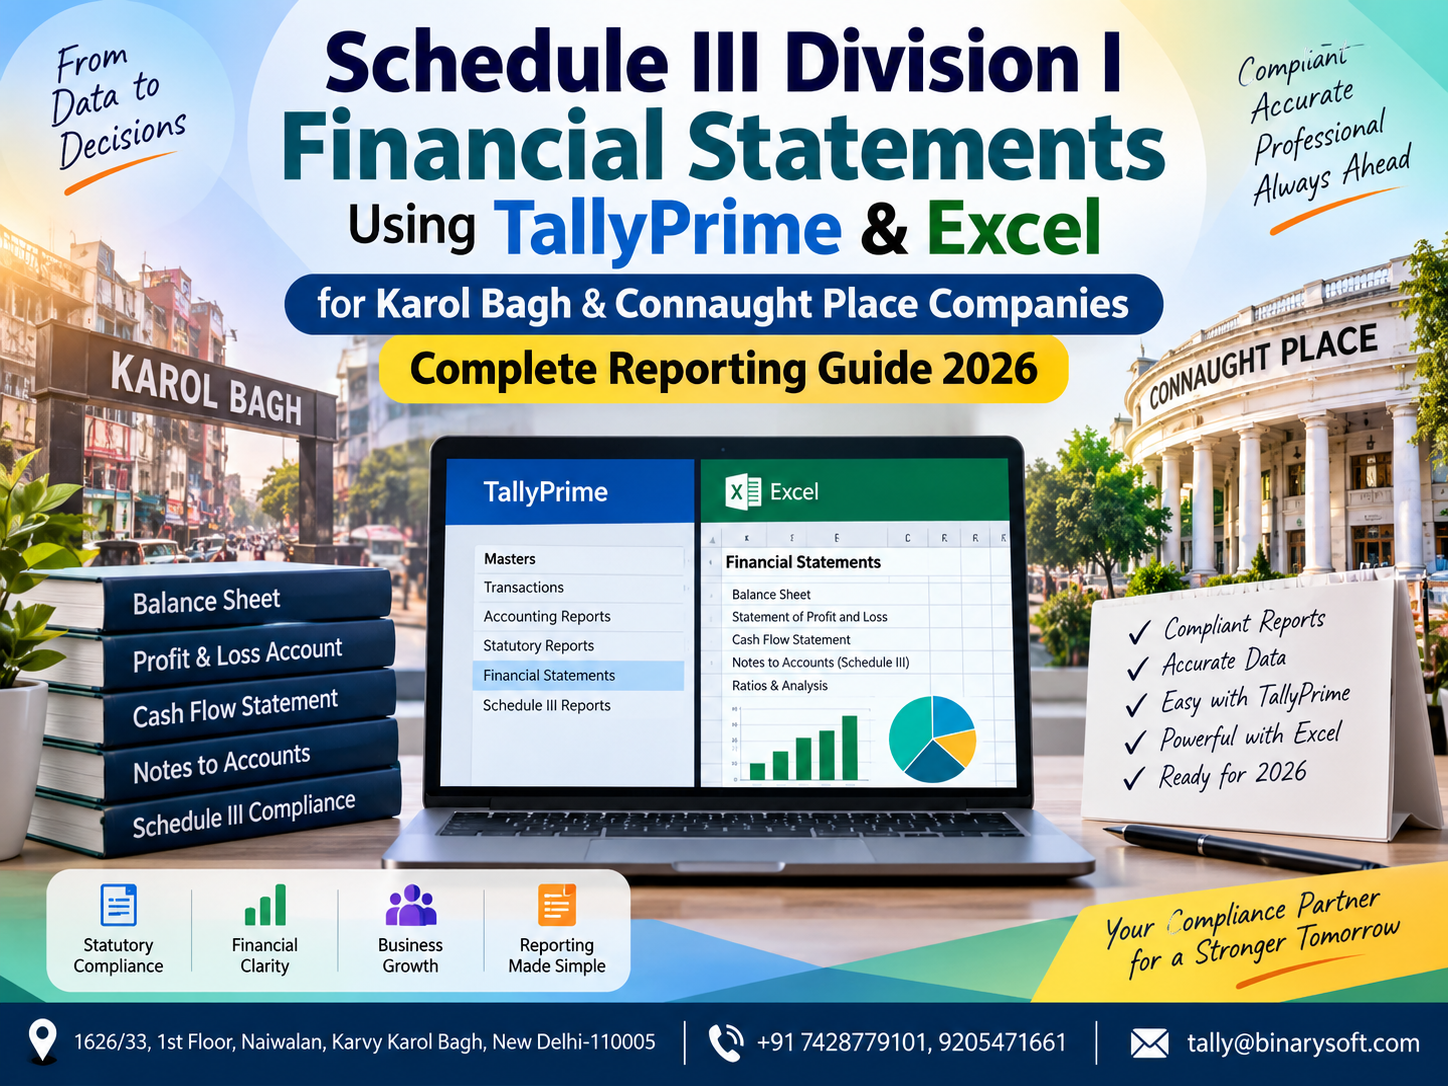
In 2026, companies in Karol Bagh and Connaught Place are under growing pressure to turn day-to-day accounting data into structured, review-ready financial statements without spending days manually rearranging ledgers in Excel. The challenge is that a Trial Balance or Balance Sheet generated from TallyPrime does not automatically become a Schedule III Division I presentation. Companies still need correct grouping, current and non-current classification, comparative figures, notes, disclosures and consistency between the Balance Sheet, Statement of Profit and Loss and supporting schedules. A practical TallyPrime-to-Excel reporting workflow can reduce this pressure by extracting accounting data, mapping ledgers to defined reporting heads and using a controlled Excel template for financial statement preparation. The benefit is not simply faster formatting. A well-designed process improves traceability from the final financial statements back to the underlying books, reduces repetitive Excel work and makes review, reconciliation and year-end reporting significantly more manageable.
Understanding Schedule III Division I Financial Statements in 2026
Preparing financial statements for a company is not simply a matter of taking a Trial Balance from accounting software and placing the figures into a Balance Sheet.
The Companies Act, 2013 and Schedule III prescribe presentation and disclosure requirements for financial statements of companies covered by the relevant division.
Division I of Schedule III applies to companies whose financial statements are prepared in accordance with the Companies (Accounting Standards) Rules, 2021.
This distinction is important because Schedule III contains multiple divisions, and the applicable reporting framework needs to be identified before financial statement preparation begins.
For businesses in Karol Bagh, Connaught Place and across Delhi, TallyPrime can serve as the core accounting system where day-to-day transactions are recorded.
Excel can then be used as a structured reporting layer for mapping, classification, schedules, notes, comparative analysis and final financial statement preparation.
A properly designed workflow can therefore look like:
TallyPrime Accounting Data
↓
Trial Balance Extraction
↓
Ledger Mapping
↓
Schedule III Classification
↓
Excel Financial Statement Template
↓
Validation and Reconciliation
↓
Balance Sheet
↓
Statement of Profit and Loss
↓
Notes to Accounts and Supporting Disclosures
The objective is to maintain a clear connection between the books of account and the final financial statements.
Why Schedule III Reporting Can Become Difficult
Companies may maintain accurate books in TallyPrime but still encounter difficulties during finalization.
Why?
Because accounting and financial statement presentation are related but different processes.
A TallyPrime ledger may be created primarily for operational accounting.
For example:
ICICI Bank Current Account
HDFC Bank Current Account
Director Loan
Security Deposit
Advance to Supplier
Outstanding Salary
GST Payable
Professional Charges
Office Rent
Computer Equipment
The financial statements may require these balances to be classified under specific Schedule III heads and supported through appropriate notes.
Therefore, the reporting team needs to answer two questions:
What is the balance?
Where should the balance be presented?
The first question comes primarily from accounting records.
The second requires classification, reporting judgment and applicable disclosure requirements.
A Karol Bagh Company's Year-End Story
Consider a fictional trading company operating from Karol Bagh.
Throughout the financial year, its accounting team maintained purchases, sales, expenses, receipts, payments, GST entries and bank transactions in TallyPrime.
The books appeared organized.
When management requested year-end financial statements, the accountant exported the Trial Balance to Excel.
That was when the real work started.
More than 300 ledgers appeared in the spreadsheet.
There were customer advances, security deposits, employee advances, old vendor balances, statutory liabilities, loans, prepaid expenses, fixed assets and several expense accounts.
Some ledger names were clear.
Others were not.
One ledger simply said:
“Advance Account.”
The accountant could not immediately determine whether it represented an advance to a supplier, an employee advance or another recoverable amount.
Another ledger was called:
“Loan.”
Was it secured or unsecured?
Was it from a director?
Was it repayable within the relevant period?
The managing director expected the statements that evening.
The accountant looked at hundreds of Excel rows and realized that the challenge was not calculating totals.
It was classification.
The company subsequently introduced a mapping-based reporting workbook.
Each Tally ledger was assigned to a standardized reporting head. Supporting classifications and review comments were maintained separately. The next reporting cycle no longer started from a blank Excel sheet.
The accountant still reviewed the figures, but the repetitive mapping work had been dramatically reduced.
That is the practical advantage of combining TallyPrime with a controlled Excel financial reporting framework.
What Is Schedule III Division I?
Schedule III provides the general framework for presentation of financial statements by companies under the Companies Act, 2013.
Division I relates to companies preparing financial statements in accordance with the applicable Accounting Standards framework rather than Ind AS.
A complete financial reporting exercise may involve, as applicable:
Balance Sheet
Statement of Profit and Loss
Notes to Accounts
Comparative information
Supporting schedules
Accounting policies and other disclosures
Additional regulatory disclosures
The exact requirements depend on the company's circumstances and the applicable legal and accounting framework.
Businesses should therefore determine their reporting framework before selecting a financial statement template.
Why TallyPrime and Excel Work Well Together
TallyPrime and Excel perform different roles.
TallyPrime can be the accounting engine.
Excel can be the reporting and presentation layer.
TallyPrime may contain:
Ledgers
Groups
Vouchers
Sales
Purchases
Receipts
Payments
Journal entries
Inventory
Outstanding balances
Bank transactions
GST-related accounting data
Excel can then be used for:
Ledger mapping
Financial statement classification
Comparative figures
Schedule preparation
Notes
Ratios
Cross-checks
Management adjustments
Presentation
Review comments
Instead of manually typing Tally balances into Excel every year, companies can establish a controlled extraction and mapping process.
The Core TallyPrime-to-Excel Reporting Workflow
A practical reporting process can be divided into several stages.
Accounting Data
↓
Trial Balance
↓
Data Extraction
↓
Ledger Master Mapping
↓
Schedule III Heads
↓
Sub-classification
↓
Current / Non-current Classification
↓
Adjustments
↓
Financial Statements
↓
Notes and Disclosures
↓
Cross-verification
↓
Final Review
Each stage should have its own control checks.
Step 1: Finalize the TallyPrime Books
Before preparing Schedule III financial statements, the accounting records should be substantially complete.
Review:
Sales
Purchases
Expenses
Receipts
Payments
Journal entries
Bank entries
GST-related entries
Payroll-related entries where applicable
Depreciation
Provisions
Accruals
Prepaid expenses
Outstanding expenses
Year-end adjustments
Financial statements generated from incomplete books will remain incomplete regardless of how sophisticated the Excel template is.
Step 2: Generate the Trial Balance
The Trial Balance becomes an important starting point for the reporting process.
It provides closing balances of the relevant ledgers and groups.
The reporting team should confirm that the Trial Balance represents the correct company and financial period.
Before proceeding, verify:
Opening balances
Debit totals
Credit totals
Closing balances
Year-end journal entries
Suspense balances
Unusual negative balances
The Trial Balance should also be reconciled with relevant subsidiary information wherever necessary.
Step 3: Export TallyPrime Data to Excel
Once the books are ready for reporting, the required accounting data can be exported or otherwise transferred into a structured Excel workbook using an appropriate supported workflow.
The Excel source sheet may contain fields such as:
Ledger Name
Tally Group
Opening Debit
Opening Credit
Current-Year Debit
Current-Year Credit
Closing Balance
Previous-Year Balance
Reporting Code
Schedule III Head
Note Number
Classification
A structured format makes subsequent mapping much easier.
Step 4: Create a Ledger Mapping Master
This is one of the most valuable parts of the entire system.
Instead of manually deciding where every ledger belongs each year, maintain a permanent mapping master.
For example:
| Tally Ledger | Reporting Head | Sub-Head |
|---|
| Equity Share Capital |
Share Capital |
Equity Share Capital |
| General Reserve |
Reserves & Surplus |
General Reserve |
| HDFC Term Loan |
Borrowings |
Term Loan |
| Trade Debtors |
Trade Receivables |
Receivables |
| Trade Creditors |
Trade Payables |
Payables |
| Office Equipment |
Property, Plant & Equipment |
Office Equipment |
| Sales Account |
Revenue from Operations |
Sale of Goods |
| Salary Expense |
Employee Benefits Expense |
Salaries |
| Audit Fee |
Other Expenses |
Professional Fees |
This is only an illustrative mapping.
Actual classification must be determined according to the nature of the balance and applicable reporting requirements.
Step 5: Map Every Tally Ledger
Every material ledger appearing in the Trial Balance should be mapped.
Unmapped ledgers should not simply disappear from the final statements.
A good Excel template can maintain an exception sheet containing:
Unmapped Ledger
Balance
Tally Group
Suggested Reporting Head
Review Status
Reviewer Comment
This provides an important control.
If the unmapped balance is not zero, the financial statement preparation process is not complete.
Step 6: Classify Assets Correctly
Schedule III reporting requires assets to be presented under appropriate classifications.
Depending on the nature of the company and balance, reporting may include categories such as:
Non-current assets
Property, plant and equipment
Intangible assets
Non-current investments
Long-term loans and advances or other applicable classifications
Other non-current assets
Current assets
Inventories
Trade receivables
Cash and cash equivalents
Short-term loans and advances or other applicable classifications
Other current assets
The precise classification should follow the applicable Schedule III requirements and the underlying nature of the asset.
Step 7: Understand Current and Non-Current Classification
Current versus non-current classification is a key part of Schedule III reporting.
Classification should not be decided merely from the ledger name.
Relevant factors can include the company's operating cycle, expected realization or settlement period and other criteria under the applicable reporting framework.
For example, two deposits with identical ledger names may require different presentation depending on their terms and expected realization.
This is why automated mapping should allow review overrides.
Automation can suggest or carry forward classifications.
Professional judgment still needs to confirm them.
Step 8: Classify Equity and Liabilities
The equity and liabilities section may include relevant categories such as:
Shareholders' funds
Share capital
Reserves and surplus
Non-current liabilities
Long-term borrowings
Deferred tax liabilities where applicable
Long-term provisions
Other non-current liabilities
Current liabilities
Short-term borrowings
Trade payables
Other current liabilities
Short-term provisions
Again, the exact presentation depends on the applicable reporting requirements and facts of the company.
Step 9: Prepare the Statement of Profit and Loss
The Statement of Profit and Loss requires systematic mapping of income and expenditure.
Typical reporting categories may include:
Revenue from operations
Other income
Cost-related expenses
Purchases of stock-in-trade where applicable
Changes in inventories
Employee benefits expense
Finance costs
Depreciation and amortisation expense
Other expenses
Tax expense
Profit or loss for the period
The objective is to convert numerous operational ledgers into understandable financial reporting categories.
Revenue from Operations
A company may maintain several revenue ledgers in TallyPrime.
For example:
Local Sales
Inter-State Sales
Export Sales
Service Revenue
Online Sales
Wholesale Sales
The financial statements may need these balances to be appropriately grouped under revenue from operations, with further disclosure where required.
A mapping-based Excel template can consolidate the ledgers automatically while preserving the source-level detail for review.
Other Income
Other income should be distinguished from revenue generated through normal operations where applicable.
Examples could include:
Interest income
Certain gains
Rental income where not part of ordinary operations
Other miscellaneous income
The nature of each balance should be reviewed before classification.
Employee Benefits Expense
A company may maintain multiple payroll-related ledgers:
Salary
Wages
Bonus
Employer contributions
Staff welfare
Leave-related expenses
Other employee benefits
These may need to be grouped and disclosed appropriately under the applicable reporting structure.
A standardized mapping reduces repetitive manual regrouping.
Finance Costs
Interest and other finance-related costs should be reviewed carefully.
The reporting team should identify relevant balances and classify them according to applicable requirements.
A ledger called “Bank Charges” should not automatically be treated identically to “Interest on Term Loan.”
The nature of the expense matters.
Depreciation and Amortisation
Depreciation should reconcile with the company's fixed asset records and applicable accounting policies.
The reporting workflow should ensure consistency between:
Opening asset balances
Additions
Disposals
Depreciation
Closing balances
The corresponding notes should reconcile with the Balance Sheet.
Property, Plant and Equipment Reporting
Property, plant and equipment can require detailed supporting schedules.
Depending on the reporting requirements, companies may need information covering:
Opening gross carrying amount
Additions
Disposals
Closing gross carrying amount
Opening accumulated depreciation
Depreciation for the year
Adjustments
Closing accumulated depreciation
Net carrying amount
Maintaining a fixed asset register alongside TallyPrime can make this reconciliation significantly easier.
Trade Receivables
Trade receivables deserve particular attention.
A simple debtor total may not provide all the information required for financial reporting.
The accounts team may need additional analysis based on applicable Schedule III disclosure requirements and the company's facts.
Therefore, customer-level data may need to be extracted and analyzed separately from the Trial Balance.
The final receivable figure must reconcile with the relevant control account.
Trade Payables
Trade payables may similarly require additional classification and disclosure.
Vendor balances should be reviewed carefully.
Relevant considerations may include:
Nature of payable
Outstanding period
MSME-related information where applicable
Disputed balances where relevant
Debit balances within creditor accounts
The Trial Balance provides the starting balance, but supporting analysis may be required for disclosure.
Inventory Reporting
For businesses maintaining inventory in TallyPrime, closing stock should reconcile with the financial statements.
Inventory may include:
Raw materials
Work-in-progress
Finished goods
Stock-in-trade
Stores and consumables
Other relevant inventory categories
The exact classification depends on the nature of the business.
Manufacturing companies should pay particular attention to the connection between production records, stock valuation and financial reporting.
Cash and Cash Equivalents
Bank and cash balances should be verified before finalization.
Check:
Cash-in-hand
Current accounts
Relevant deposit balances
Bank reconciliation differences
Unpresented cheques
Uncleared receipts
Stale entries
Do not rely only on the ledger closing balance without performing the required reconciliation.
Borrowings
Borrowings require careful classification.
The accounts team may need to understand:
Nature of borrowing
Security
Repayment terms
Current and non-current portions
Interest
Default information where applicable
Relationship with lenders
A ledger name alone is rarely sufficient for complete financial statement disclosure.
Related Party Balances
Transactions and balances involving related parties may require separate identification and disclosure under applicable requirements.
Businesses should therefore maintain appropriate tagging or supporting schedules rather than trying to identify all related-party transactions only at year-end.
Comparative Figures
Financial statements generally contain comparative information.
A reporting workbook should therefore be designed to accommodate both:
Current Year
Previous Year
For example:
| Particulars | 31 March 2026 | 31 March 2025 |
|---|
| Share Capital |
Current Year |
Previous Year |
| Reserves & Surplus |
Current Year |
Previous Year |
| Borrowings |
Current Year |
Previous Year |
| Trade Payables |
Current Year |
Previous Year |
Comparative reporting helps readers understand movements between periods.
It also introduces an important control requirement: prior-year figures should remain consistently mapped unless a justified reporting change is made.
How Excel Can Automate Schedule III Reporting
A well-designed Excel financial statement template can contain several worksheets.
Sheet 1: Raw Trial Balance
This contains the data extracted from TallyPrime.
Sheet 2: Ledger Mapping
This maps every ledger to its reporting head.
Sheet 3: Adjustments
This records approved reporting adjustments separately from raw accounting data.
Sheet 4: Balance Sheet
This automatically summarizes mapped balances.
Sheet 5: Statement of Profit and Loss
This consolidates income and expenditure.
Sheet 6: Notes
This contains supporting schedules and disclosures.
Sheet 7: Ratios
This calculates required or management ratios where applicable.
Sheet 8: Validation
This contains reconciliation and exception checks.
This structure provides better control than manually editing the final Balance Sheet.
Important Excel Validation Controls
An effective reporting workbook should contain automatic checks.
For example:
Trial Balance Difference = 0
Unmapped Ledgers = 0
Balance Sheet Difference = 0
Profit as per P&L = Profit reflected in Balance Sheet movement, subject to applicable adjustments
Notes Total = Main Financial Statement Total
Current-Year Data Available = Yes
Previous-Year Data Available = Yes
These checks immediately highlight reporting problems.
Avoid Hard-Coding Figures in the Final Statements
One of the most common Excel reporting mistakes is manually typing numbers into the final Balance Sheet or Statement of Profit and Loss.
For example:
Trade Receivables = ₹28,45,600
If that amount is typed manually, a subsequent change to the Trial Balance may not update the financial statements.
Instead, the final figure should ideally be derived from mapped source data or controlled adjustment schedules.
The principle should be:
Source Data → Mapping → Formula/Controlled Logic → Final Statement
not:
Source Data → Manual Typing → Final Statement
Keep Adjustments Separate
Auditors and accountants frequently identify adjustments during financial statement preparation.
Instead of modifying source data without a clear trail, maintain a controlled adjustment sheet.
For example:
| Adjustment Ref. | Ledger | Debit | Credit | Reason | Approved By |
|---|
| ADJ-001 |
Expense Accrual |
50,000 |
0 |
Year-end accrual |
Reviewer |
| ADJ-001 |
Outstanding Expense |
0 |
50,000 |
Year-end accrual |
Reviewer |
This creates a transparent audit trail.
Where an adjustment also needs to be reflected in the books, the corresponding accounting entry should be passed through the appropriate process.
Use Reporting Codes Instead of Only Ledger Names
Ledger names can change.
Reporting codes are more stable.
For example:
SCH-EQ-001 = Share Capital
SCH-LIA-010 = Trade Payables
SCH-AST-020 = Trade Receivables
SCH-REV-001 = Revenue from Operations
SCH-EXP-015 = Employee Benefits Expense
Each Tally ledger can be linked to a reporting code.
This makes the reporting system easier to maintain.
Why a Mapping Master Saves Time Every Year
Suppose a company has 600 ledgers.
Without a mapping master, the accounts team may classify the same 600 ledgers every year.
With a mapping master:
Existing ledgers retain their mapping.
Only new or changed ledgers require attention.
The annual reporting process becomes:
Import Trial Balance
↓
Identify New Ledgers
↓
Review Changes
↓
Update Mapping
↓
Refresh Statements
This can significantly reduce repetitive year-end work.
Handling New Tally Ledgers
Every new ledger should trigger a reporting review.
The system should not automatically hide an unmapped ledger.
Instead, an exception message should indicate:
“New Ledger – Reporting Mapping Required.”
The reporting team can then determine the correct Schedule III classification.
This simple control can prevent balances from being omitted.
Schedule III Reporting for Karol Bagh Companies
Karol Bagh contains businesses across trading, automobiles, jewellery, hospitality, retail, professional services, distribution and other sectors.
Companies operating in these sectors may maintain large numbers of customer, supplier, expense and inventory ledgers.
As the ledger count increases, manual financial statement preparation becomes more difficult.
A structured TallyPrime-to-Excel reporting process can help maintain consistency across reporting periods.
Schedule III Reporting for Connaught Place Companies
Connaught Place hosts companies and professional organizations operating across services, consulting, technology, finance, retail, hospitality and corporate activities.
Such organizations may have financial statements involving:
Service revenue
Professional expenses
Employee costs
Lease-related expenses
Deposits
Investments
Borrowings
Receivables
Inter-company balances
Related-party transactions
The accounting may already exist in TallyPrime, but financial statement preparation still requires structured classification and disclosure.
A controlled Excel reporting workbook can provide that bridge.
Financial Statement Review Workflow
A practical review hierarchy may be:
Preparer
↓
Accounts Manager
↓
Finance Head
↓
Auditor / Reviewer
↓
Management Approval
Each stage should review relevant items rather than modifying the same uncontrolled spreadsheet.
Version control is particularly important.
Files named:
Final.xlsx
Final-New.xlsx
Final-New2.xlsx
Final-Latest.xlsx
Final-Latest-Corrected.xlsx
can create serious confusion.
Use controlled file naming and version management.
Maintain a Financial Reporting Audit Trail
Every significant adjustment should be traceable.
Maintain information such as:
Original Tally balance
Mapped balance
Reporting adjustment
Final balance
Adjustment reference
Reason
Prepared by
Reviewed by
Date
This allows reviewers to understand how the final financial statement amount was derived.
Schedule III Notes to Accounts
The face of the Balance Sheet and Statement of Profit and Loss provides summarized information.
Supporting notes provide additional detail.
A reporting system should therefore connect every major financial statement line item to the corresponding note.
For example:
Balance Sheet
Trade Receivables – Note 12
↓
Note 12
Detailed Trade Receivables Disclosure
The note total should reconcile exactly with the amount appearing in the Balance Sheet.
Automated Note Numbering
A controlled Excel template can automatically link reporting heads with note numbers.
This helps reduce manual errors when schedules are added or reorganized.
For example:
Property, Plant and Equipment – Note 10
Inventories – Note 11
Trade Receivables – Note 12
Cash and Cash Equivalents – Note 13
The actual numbering should follow the company's financial statement structure.
Ratio Analysis and Additional Disclosures
Schedule III reporting may require additional disclosures and ratio-related information depending on the applicable requirements.
A reporting workbook can maintain separate calculation sheets for relevant ratios.
Rather than manually typing ratio values into the final document, the figures should be connected to verified financial statement data wherever practical.
Where a significant variance requires explanation under applicable requirements, the explanation should be based on the company's actual circumstances.
Common Schedule III Reporting Mistakes
Incorrect Ledger Mapping
A balance is assigned to the wrong financial statement head.
Missing Ledgers
New ledgers are not included in the mapping table.
Wrong Current/Non-Current Classification
Balances are classified solely based on ledger names rather than their nature and applicable criteria.
Hard-Coded Excel Figures
Amounts are manually entered and no longer update when source data changes.
Comparative Figures Do Not Match
Previous-year amounts are incorrectly mapped or overwritten.
Notes Do Not Reconcile
The detailed schedule total differs from the face of the financial statements.
Unexplained Suspense Balances
Temporary accounts remain unresolved at finalization.
Inconsistent Rounding
Different worksheets use inconsistent rounding conventions.
Incorrect Sign Presentation
Debit and credit balances may be displayed incorrectly because of inconsistent formula logic.
How to Reconcile TallyPrime with the Final Financial Statements
The final reporting workbook should provide a reconciliation from TallyPrime to the financial statements.
At the highest level:
Total Debits = Total Credits
Then verify:
Total Assets = Total Equity and Liabilities
and confirm that:
Mapped Trial Balance
Approved Adjustments
=
Final Financial Statements
Every material difference should have an explanation.
TallyPrime-to-Excel Financial Reporting Checklist
Before finalization, verify the following:
TallyPrime books are updated.
Year-end adjustments are recorded or separately controlled.
Trial Balance is extracted for the correct period.
Opening balances are verified.
All ledgers are mapped.
Unmapped ledger balance is zero.
Assets are appropriately classified.
Liabilities are appropriately classified.
Income and expenses are mapped.
Current/non-current classification has been reviewed.
Trade receivables are reconciled.
Trade payables are reconciled.
Inventory is reconciled.
Bank balances are reconciled.
Fixed assets and depreciation are reconciled.
Borrowings are reviewed.
Comparative figures are available.
Notes reconcile with main statements.
Adjustments have an audit trail.
Balance Sheet difference is zero.
Final figures are reviewed before issue.
Why Automation Does Not Replace Professional Judgment
A reporting template can automate:
Data extraction
Mapping
Aggregation
Formula calculations
Comparative presentation
Cross-checking
Exception identification
But software cannot automatically determine every accounting judgment correctly.
For example, whether a particular balance should be current or non-current may depend on contractual terms and the applicable accounting framework.
Similarly, disclosure requirements may depend on facts that are not contained in a ledger name.
The ideal approach therefore combines:
Automation for repetitive work
Professional review for judgment
This produces a stronger financial reporting process.
Benefits of TallyPrime and Excel Schedule III Automation
Faster Financial Statement Preparation
Mapped data can flow into reporting schedules without repeatedly entering balances.
Reduced Manual Errors
Formula-based consolidation reduces copying and pasting.
Better Traceability
Every financial statement figure can be linked back to underlying ledgers.
Easier Auditor Review
Supporting schedules and mapping information are available in a structured format.
Consistent Year-to-Year Reporting
Existing mappings can be carried forward.
Better Management Visibility
Management can review financial information in a standardized format.
Easier Correction
If a Trial Balance changes, linked financial statements can be refreshed rather than manually rewritten.
Moving from Manual Excel Reporting to Controlled Automation
Many companies already use Excel for financial statements.
The problem is not Excel itself.
The problem is uncontrolled Excel.
An effective workbook should avoid:
Random formulas
Manual totals
Hidden hard-coded numbers
Broken links
Multiple uncontrolled versions
Unexplained adjustments
Instead, it should use:
Structured source data
Mapping tables
Reporting codes
Controlled formulas
Validation checks
Adjustment registers
Version control
Reviewer sign-off
Excel then becomes a controlled reporting tool rather than merely a collection of spreadsheets.
Building a Repeatable Financial Reporting Process for 2026
The ultimate objective is to avoid rebuilding the financial statements from scratch every year.
A scalable process can look like:
TallyPrime
↓
Standard Trial Balance Export
↓
Automated Excel Import
↓
Existing Ledger Mapping
↓
New Ledger Exception Report
↓
Schedule III Classification
↓
Current / Non-Current Review
↓
Adjustment Entries
↓
Balance Sheet
↓
Statement of Profit and Loss
↓
Notes
↓
Disclosure Checklist
↓
Validation
↓
Reviewer Approval
Once this structure is established, the reporting team can focus on changes and exceptions instead of repetitive formatting.
From Trial Balance to Board-Ready Financial Statements
A Trial Balance is an accounting output.
Financial statements are a reporting output.
The transformation between the two requires:
Classification
Aggregation
Presentation
Disclosure
Reconciliation
Review
A strong TallyPrime-to-Excel system manages this transformation systematically.
For companies in Karol Bagh and Connaught Place, this can be especially valuable when the business has numerous ledgers, multiple revenue streams, extensive vendor and customer balances or recurring year-end reporting requirements.
Why 2026 Is a Good Time to Standardize the Reporting Process
As businesses grow, financial reporting becomes more data-intensive.
Continuing to depend on manually prepared spreadsheets creates operational risk.
One employee may understand every formula today.
If that employee changes roles, the next person may struggle to understand the workbook.
A standardized reporting template creates organizational knowledge.
It documents:
Where data comes from
How ledgers are mapped
How figures are calculated
Which adjustments were made
How totals are validated
Who reviewed the statements
This makes financial reporting more sustainable.
Conclusion
Preparing Schedule III Division I financial statements in 2026 requires much more than exporting a Balance Sheet from TallyPrime and changing its format in Excel. Companies in Karol Bagh and Connaught Place need a structured process that connects their accounting books with the applicable financial statement presentation, classifications, notes, comparative figures and disclosures.
TallyPrime can serve as the foundation for reliable transaction-level accounting, while a carefully designed Excel reporting framework can transform the Trial Balance into structured financial statements.
The most effective workflow begins with finalized books, followed by Trial Balance extraction, ledger mapping, Schedule III classification, current and non-current review, controlled adjustments, note preparation and comprehensive reconciliation.
Automation can significantly reduce repetitive work, but accounting judgment and professional review remain essential.
The goal should not simply be to prepare financial statements faster. It should be to create a reporting process where every material figure can be traced from the final Schedule III statement back to its underlying TallyPrime ledger and supporting documentation.
A repeatable TallyPrime-to-Excel financial reporting framework can help companies reduce year-end pressure, improve consistency and make financial statement preparation more controlled, transparent and review-friendly.
Frequently Asked Questions
What is Schedule III Division I?
Schedule III Division I provides financial statement presentation requirements for companies covered by the applicable Accounting Standards framework under the Companies Act, 2013. Companies should confirm which division and accounting framework apply to them before preparing their financial statements.
Can Schedule III financial statements be prepared directly from TallyPrime?
TallyPrime can provide the underlying accounting data and reports, but Schedule III financial statement preparation may require additional classification, mapping, disclosures, notes and reporting adjustments.
CA. T.R Venkat is a Chartered Accountant with extensive experience in accounting systems, GST compliance, and MSME advisory. He has worked closely with Indian traders and businesses on inventory control and accounting process improvement. His writing draws from real operational challenges faced by growing enterprises.