Call CA Tally HelpDesk
+91 9205471661,
7428779101
What Changed Now: Why Companies Need a Smarter Financial Statement Process in 2026
In 2026, finance teams are under increasing pressure to turn accounting data into structured, review-ready financial statements without spending days manually copying figures between TallyPrime, Excel sheets and final reporting formats. For companies operating in Preet Vihar and Laxmi Nagar, Delhi, the challenge becomes even more visible at year-end: ledgers may be complete in TallyPrime, but preparing the Balance Sheet, Statement of Profit and Loss and detailed notes in a Schedule III Division I-oriented format can still involve repetitive Excel work. A properly designed Excel financial statement template can bridge this gap. By mapping TallyPrime data to standardized Excel schedules, businesses and accounting professionals can reduce repetitive entry, improve consistency, simplify reconciliations and create a more controlled financial-statement preparation process. The benefit is practical: less time spent rebuilding reports and more time available for checking classifications, disclosures, reconciliations and the accuracy of the final accounts.
Understanding Schedule III Division I Financial Statements
Schedule III of the Companies Act, 2013 prescribes the manner in which financial statements of applicable companies are presented. Division I broadly relates to companies whose financial statements are prepared in accordance with Accounting Standards rather than Ind AS.
For accountants, finance teams, auditors and company management, the final financial statements are much more than a Balance Sheet and Profit & Loss report.
The reporting process can involve:
-
Balance Sheet
-
Statement of Profit and Loss
-
Notes to Accounts
-
Share capital details
-
Reserve and surplus classifications
-
Borrowing schedules
-
Trade payable information
-
Property, plant and equipment details
-
Trade receivables
-
Cash and bank balances
-
Loans and advances
-
Other assets and liabilities
-
Revenue classifications
-
Employee benefit expenses
-
Finance costs
-
Other expenses
-
Additional applicable disclosures and supporting schedules
While TallyPrime is commonly used for maintaining day-to-day books of accounts, Excel is frequently used by finance professionals for working papers, schedules, mappings, adjustments, reconciliations and final reporting preparation.
This is where a structured Schedule III Division I Excel Financial Statement Template integrated with TallyPrime data can become highly useful.
Why Preet Vihar & Laxmi Nagar Companies Need a Structured Excel Template
Preet Vihar and Laxmi Nagar are important commercial areas of East Delhi, with businesses ranging from trading and professional services to distributors, private companies, educational businesses, consultants and other enterprises.
Many businesses maintain their accounts digitally but still face a significant reporting gap.
The accounting entries are available.
The trial balance is available.
Ledger balances are available.
GST and other accounting information may also be available.
But when financial statements have to be prepared, the team often starts another extensive process in Excel.
Figures are copied.
Rows are inserted.
Formulas are modified.
Previous-year sheets are duplicated.
Ledger balances are mapped manually.
Schedules are prepared separately.
Then somebody has to check whether the Balance Sheet actually tallies.
A standardized Excel financial statement template can make this workflow significantly more systematic.
A Story Many Accounts Teams Will Recognize
Imagine a growing company operating near Laxmi Nagar.
Its accounts team had maintained its books throughout the year in TallyPrime. Sales were recorded, purchases were entered, bank transactions were reconciled and most routine accounting work was already complete.
When financial statement preparation started, however, the finance executive opened the previous year's Excel workbook.
It contained dozens of worksheets.
Some formulas referred to old cells. A new expense ledger had not been mapped. Certain current liabilities were manually grouped, and the previous-year figures had been copied into different sheets.
The accounts executive spent late evenings checking one number after another.
Then came the worrying question from the senior accountant:
"Why does this figure not match the trial balance?"
It was not a huge difference.
But finding it meant going back through multiple worksheets, ledger mappings and manual adjustments.
Eventually, the problem was traced to a ledger that had been added during the year but was not included in one of the Excel formulas.
The problem was small.
The anxiety it created was not.
That experience pushed the team to rethink its process.
Instead of treating financial statement preparation as a collection of independent Excel sheets, they began using a structured workbook where TallyPrime ledger data could be imported, mapped, classified and connected to reporting schedules.
The change did not eliminate the need for professional review.
It eliminated a large part of the unnecessary repetition.
That distinction matters.
What Is a Schedule III Division I Excel Financial Statement Template?
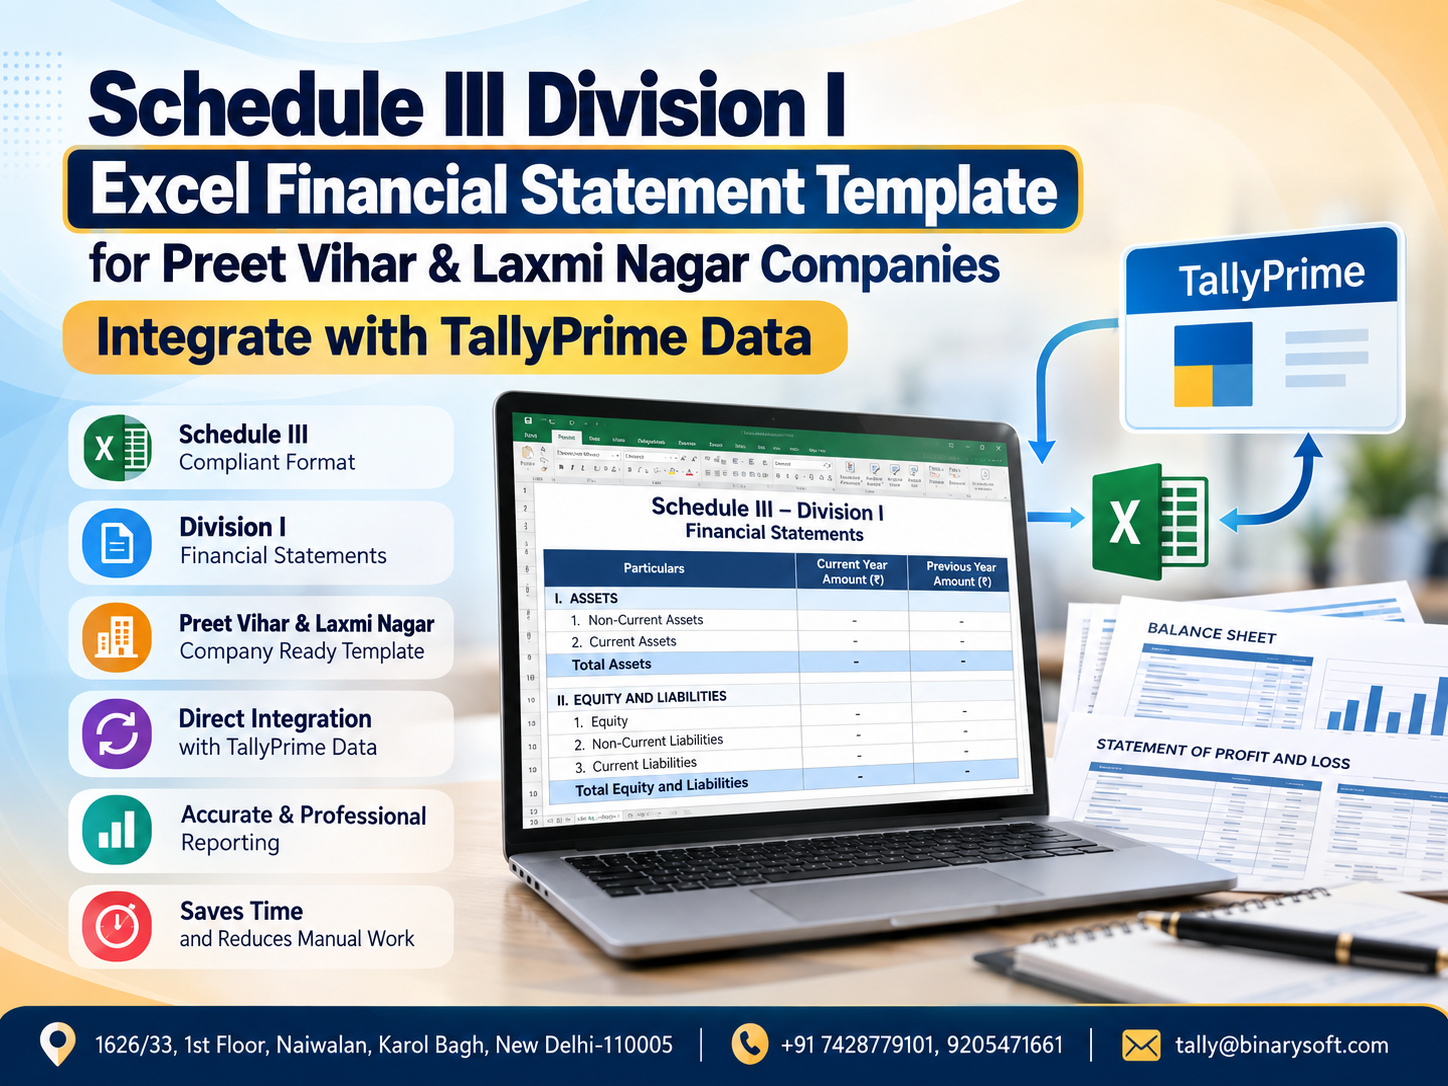
A Schedule III Division I Excel template is a structured workbook designed to organize accounting balances into appropriate financial statement headings and supporting schedules.
Instead of manually typing every financial statement figure, the workbook can be designed around a data flow such as:
TallyPrime Data → Trial Balance → Ledger Mapping → Schedule Classification → Financial Statement Schedules → Balance Sheet & Statement of Profit and Loss
The template can contain dedicated worksheets for raw accounting data, ledger mapping, schedules, financial statements, validation checks and year-on-year comparison.
This creates a centralized reporting workbook instead of multiple disconnected Excel files.
TallyPrime and Excel: Why Integration Makes Sense
TallyPrime serves as the accounting system where transactions and ledger balances are maintained.
Excel provides flexibility for:
Combining the two can therefore create a practical financial reporting workflow.
The objective is not necessarily to replace either platform.
The objective is to make accounting data move through the reporting process with fewer manual interventions.
Suggested Structure of the Excel Financial Statement Template
A professionally planned workbook can contain several interconnected worksheets.
1. Company Information
The first sheet can contain basic reporting information such as:
Company Name
CIN
Registered Address
Financial Year
Previous Financial Year
Reporting Currency
Rounding Method
PAN
GSTIN, where relevant
Authorized Signatory details
Auditor information, where required
Centralizing these details helps reduce repetitive typing across reports.
2. TallyPrime Data Import Sheet
This worksheet acts as the source-data area.
Data exported from TallyPrime can be brought into the workbook in a structured format.
Typical fields can include:
Ledger Name
Parent Group
Opening Balance
Debit Movement
Credit Movement
Closing Balance
Previous-Year Balance
Voucher or transaction-level information where required
The exact structure depends on the reporting workflow and the data available from the accounting system.
The important principle is to keep imported source data separate from presentation sheets.
3. Ledger Mapping Master
This can become one of the most important worksheets in the entire template.
Each TallyPrime ledger can be assigned to an appropriate financial statement classification.
For example:
| TallyPrime Ledger | Tally Group | Financial Statement Mapping |
|---|
| Equity Share Capital |
Capital Account |
Share Capital |
| General Reserve |
Reserves & Surplus |
Reserves and Surplus |
| Bank Term Loan |
Secured Loans |
Borrowings |
| Supplier A |
Sundry Creditors |
Trade Payables |
| Customer A |
Sundry Debtors |
Trade Receivables |
| HDFC Current Account |
Bank Accounts |
Cash and Bank Balances |
| Office Rent |
Indirect Expenses |
Other Expenses |
| Salary Expense |
Indirect Expenses |
Employee Benefits Expense |
| Interest on Loan |
Indirect Expenses |
Finance Costs |
Once a ledger is correctly mapped, the workbook can use formulas or other appropriate Excel mechanisms to pull its balance into the relevant schedule.
4. Balance Sheet
The Balance Sheet can be structured under appropriate broad classifications, subject to the requirements applicable to the company.
Typical sections can include:
Equity and Liabilities
Shareholders' Funds
Share Capital
Reserves and Surplus
Non-Current Liabilities
Long-Term Borrowings
Deferred Tax Liabilities, where applicable
Other Long-Term Liabilities
Long-Term Provisions
Current Liabilities
Short-Term Borrowings
Trade Payables
Other Current Liabilities
Short-Term Provisions
Assets
Non-Current Assets
Property, Plant and Equipment
Intangible Assets
Non-Current Investments
Deferred Tax Assets, where applicable
Long-Term Loans and Advances
Other Non-Current Assets
Current Assets
Current Investments
Inventories
Trade Receivables
Cash and Bank Balances
Short-Term Loans and Advances
Other Current Assets
The exact presentation and disclosures should always be checked against the requirements applicable to the company for the relevant reporting period.
5. Statement of Profit and Loss
A linked Statement of Profit and Loss worksheet can summarize income and expenses mapped from TallyPrime.
Common sections can include:
Revenue from Operations
Other Income
Total Income
Expenses may include:
Cost of Materials Consumed
Purchases of Stock-in-Trade
Changes in Inventories
Employee Benefits Expense
Finance Costs
Depreciation and Amortisation Expense
Other Expenses
The workbook can then calculate profit before tax, applicable tax-related figures and profit after tax based on the reporting structure and adjustments used by the finance team.
6. Notes to Financial Statements
Detailed schedules are critical because the face of the financial statements contains summarized figures.
A structured workbook can provide separate worksheets or sections for supporting notes.
Examples include:
Share Capital
Reserves and Surplus
Borrowings
Trade Payables
Other Liabilities
Provisions
Property, Plant and Equipment
Investments
Inventories
Trade Receivables
Cash and Bank Balances
Loans and Advances
Revenue from Operations
Other Income
Employee Benefits
Finance Costs
Other Expenses
The Balance Sheet and Statement of Profit and Loss can then reference these schedules instead of relying on manually entered totals.
Comparative Previous-Year Figures
Financial reporting generally requires comparative information as applicable.
Therefore, a useful Excel template should not be designed only around current-year balances.
It can include dedicated columns for:
Current Year | Previous Year
This allows the finance team to identify significant movements and check whether previous-period figures remain consistently classified.
It also makes management-level review easier.
If a particular expense suddenly increases substantially, the reviewer can investigate the underlying reason rather than discovering it after finalization.
Automated Balance Sheet Checking
One of the most useful controls in a financial statement workbook is a basic accounting equation validation.
The template can calculate:
Total Assets – Total Equity & Liabilities
Expected result:
0
If the result is not zero, the workbook can flag the difference for investigation.
This does not prove that every classification is correct, but it provides a valuable basic control against incomplete mappings or calculation errors.
Unmapped Ledger Report
Imagine having 500 ledgers in TallyPrime.
If 497 are correctly mapped and three remain unmapped, those three ledgers can create discrepancies or incomplete reporting.
A dedicated Unmapped Ledgers section can identify any source ledger for which a reporting classification has not yet been assigned.
For example:
Unmapped Ledger Count: 3
The accounts team can resolve these items before finalizing the reports.
This is much safer than discovering the problem during the final review.
Mapping Validation
A stronger workbook can perform several validation checks.
For example:
Total TallyPrime Trial Balance = Total Mapped Trial Balance
If these totals do not reconcile, the workbook should highlight the difference.
Other controls can check:
Current-Year Balance Sheet Difference
Previous-Year Balance Sheet Difference
Unmapped Ledger Count
Duplicate Ledger Mapping
Blank Classification
Missing Previous-Year Mapping
Unexpected Debit/Credit classifications
These checks can substantially improve the review process.
Trial Balance Integration with TallyPrime
The Trial Balance is often the starting point for financial statement preparation.
A typical workflow could be:
Step 1: Finalize accounting entries in TallyPrime.
Step 2: Review the Trial Balance.
Step 3: Export the required data from TallyPrime.
Step 4: Import or paste the structured data into the designated Excel source sheet.
Step 5: Match ledger names against the mapping master.
Step 6: Identify unmapped or newly created ledgers.
Step 7: Update classifications after appropriate review.
Step 8: Refresh or recalculate schedules.
Step 9: Check the Balance Sheet and Statement of Profit and Loss.
Step 10: Review detailed notes and disclosures.
This creates a repeatable financial statement preparation process.
Why Direct Copy-Paste Is Risky
Copying numbers from TallyPrime reports into individual financial statement cells may appear quick when there are only a few figures.
But as the business grows, the number of ledgers and schedules usually increases.
Manual copying introduces risks such as:
Transposition errors
Missing balances
Wrong-year figures
Incorrect classifications
Formula overwriting
Duplicate entries
Forgotten new ledgers
Incorrect signs
Broken links between worksheets
A mapping-driven workbook reduces dependence on repeated manual data entry.
Handling New Ledgers Created During the Year
Suppose the company creates a new ledger in TallyPrime:
Digital Marketing Expense
If the previous Excel template has no mapping for it, a purely manual process might overlook the balance.
A better workbook can detect the new ledger and show it as:
Unmapped
The finance professional can then assign it to the appropriate reporting classification after considering the nature of the expenditure.
This creates a controlled exception-handling process.
Trade Receivables and Trade Payables
Receivables and payables can require more than a simple total.
A structured reporting workflow may need detailed classification and supporting information depending on applicable reporting requirements and the company's circumstances.
The workbook can be designed to receive appropriate ledger or outstanding data from TallyPrime and create supporting schedules for review.
For example, instead of showing only:
Trade Receivables: ₹42,00,000
the underlying schedule can provide the detail needed by the reporting team for classification, ageing or other applicable disclosures.
The same principle can be applied to trade payables.
Property, Plant and Equipment Schedule
A fixed asset schedule can be built with fields such as:
Asset Category
Opening Gross Block
Additions
Disposals
Closing Gross Block
Opening Accumulated Depreciation
Depreciation for the Period
Adjustments
Closing Accumulated Depreciation
Net Carrying Amount
Where TallyPrime provides relevant balances, those figures can form part of the reporting workflow, while detailed fixed-asset calculations and review can remain in Excel where appropriate.
Cash and Bank Balances
The Excel template can separately classify:
Cash in Hand
Current Bank Accounts
Savings Bank Accounts
Deposits with Banks
Other relevant balances
The schedule can also act as a reconciliation point between TallyPrime balances and supporting bank information.
Revenue Mapping
Businesses frequently use multiple sales ledgers in TallyPrime.
For example:
Local Sales
Interstate Sales
Export Sales
Service Revenue
Product Category Sales
Other Operating Revenue
Instead of manually combining them every year, each ledger can be mapped to the appropriate financial statement category.
This improves reporting consistency from one period to another.
Other Expenses Schedule
For many companies, Other Expenses is one of the longest schedules.
It can contain:
Rent
Electricity
Legal and Professional Fees
Printing and Stationery
Communication Expenses
Travelling Expenses
Repairs and Maintenance
Software Expenses
Internet Charges
Office Expenses
Insurance
Audit Fees
Marketing Expenses
Freight
Security Charges
A mapping-driven Excel workbook can automatically aggregate individual ledgers under the relevant reporting headings while preserving supporting detail for review.
Current and Non-Current Classification
Correct classification is an important part of financial reporting.
The workbook can provide mapping fields that distinguish between current and non-current items where applicable.
For example:
Loan A → Long-Term Borrowings
Loan B → Short-Term Borrowings
Security Deposit → Long-Term Loans/Advances or another appropriate classification depending on its nature
Advance Recoverable → Current Asset, where appropriate
The classification should be based on the actual nature, terms and applicable accounting/reporting requirements—not merely on the name of the ledger.
Excel Formula Protection
One common problem with financial reporting workbooks is accidental formula deletion.
A team member may paste data over a calculated cell and not notice it.
A professionally designed template can protect formula cells while keeping input areas editable.
For example:
Blue/input cells → User-editable data
Calculated cells → Protected
Imported data area → Controlled update
Financial statements → Formula-driven
This can reduce accidental changes to the workbook logic.
Separate Input and Output Sheets
A strong template should distinguish between input, calculation and output areas.
A possible workbook structure could be:
01 – Company Information
02 – Tally Data
03 – Trial Balance
04 – Ledger Mapping
05 – Adjustments
06 – Balance Sheet
07 – Profit & Loss
08 – Notes
09 – Fixed Assets
10 – Receivables
11 – Payables
12 – Other Expenses
13 – Validation
14 – Unmapped Ledgers
15 – Print Financials
This makes the workbook easier to understand and maintain.
Adjustment Entries
Financial statements may require year-end adjustments that have not yet been reflected in the initially imported trial balance.
Examples can include applicable provisions, depreciation adjustments, reclassifications, audit adjustments and other closing entries.
Instead of directly changing the imported source figures, the workbook can maintain a separate Adjustment Sheet.
A structure might include:
Ledger
Original Balance
Debit Adjustment
Credit Adjustment
Adjusted Balance
Reason
Reference
Reviewed By
This provides a clearer audit trail for the financial statement preparation process.
Why an Audit Trail Matters
Imagine a financial statement figure changes from ₹18.50 lakh to ₹19.10 lakh.
Without documentation, another team member may not know why.
Was the source data changed?
Was an adjustment posted?
Was a formula modified?
Was a ledger reclassified?
Maintaining an adjustment and mapping trail makes the change easier to understand.
This can be especially valuable when multiple accountants, management personnel and external professionals participate in the year-end process.
Benefits for Companies in Preet Vihar
Businesses in Preet Vihar can use a standardized TallyPrime-to-Excel workflow to reduce repetitive financial reporting tasks.
The approach can be particularly useful for companies that:
Maintain accounts in TallyPrime
Prepare detailed year-end Excel workings
Have multiple expense and income ledgers
Need comparative reporting
Work with external accountants or auditors
Need structured management review
Frequently create new ledgers
A reusable mapping structure also becomes more valuable in subsequent years.
Benefits for Companies in Laxmi Nagar
Laxmi Nagar has a substantial ecosystem of businesses, accounting professionals and commercial establishments.
For growing companies, accounting complexity can increase quickly.
What starts with 50 ledgers may become 200 or 500 ledgers.
Manual financial statement preparation becomes increasingly difficult to control at that scale.
A structured workbook provides a bridge between operational accounting and financial reporting.
Benefits for Chartered Accountants and Accounting Professionals
A Schedule III-oriented Excel reporting template is not useful only to companies.
Accounting and professional teams managing multiple client files can also benefit from standardization.
Instead of creating a completely different workbook for every client, a standardized framework can be adapted according to each company's requirements.
This can help with:
Consistent working papers
Faster ledger mapping
Structured review
Comparative reporting
Identification of unmapped accounts
Adjustment tracking
Schedule preparation
Print-ready financial statements
Professional judgment remains essential, but repetitive spreadsheet work can be reduced.
Reducing Year-End Pressure
Year-end financial statement preparation often becomes stressful because multiple activities happen simultaneously.
Books are being finalized.
Reconciliations are pending.
Supporting documents are being collected.
Adjustments are being discussed.
Management wants figures.
Auditors may require schedules.
The finance team is checking disclosures.
A well-designed template cannot eliminate all of this work.
It can, however, reduce avoidable manual repetition.
That is where the real productivity benefit comes from.
Financial Statement Dashboard
A useful workbook can also include a compact validation dashboard.
For example:
Trial Balance Imported: Yes
Total Ledgers: 428
Mapped Ledgers: 426
Unmapped Ledgers: 2
Balance Sheet Difference: ₹0
Previous-Year Difference: ₹0
Adjustment Entries: 7
Review Status: Pending
This gives the reviewer an immediate picture of the workbook's status.
Year-on-Year Analysis
Because current and previous-year figures can exist in the same reporting structure, the workbook can calculate percentage movements.
For example:
| Particulars | Previous Year | Current Year | Change |
|---|
| Revenue |
₹4.20 Cr |
₹5.10 Cr |
21.43% |
| Employee Cost |
₹52 Lakh |
₹61 Lakh |
17.31% |
| Finance Cost |
₹11 Lakh |
₹14 Lakh |
27.27% |
Large changes can then be reviewed.
This analytical layer can help management understand the numbers rather than simply producing them.
TallyPrime Data Refresh
A reusable integration process should make subsequent data updates easier.
For example, suppose the first trial balance is imported on 10 April.
After review, several closing entries are posted in TallyPrime.
A new trial balance is then exported.
Instead of rebuilding the financial statements, the source-data sheet can be updated and mapped reports recalculated.
The financial statements can then reflect the revised balances while retaining the established reporting structure.
Avoid Hard-Coded Numbers
One of the most important design principles for financial statement templates is to minimize hard-coded values in output reports.
For example, instead of typing:
Revenue from Operations = ₹5,10,00,000
the financial statement cell should ideally derive the figure from mapped source data or an appropriate supporting schedule.
This makes future updates easier and reduces the chance of a figure remaining unchanged after the underlying accounting data has been revised.
Review Before Finalization
Automation does not mean automatic compliance.
Every financial statement should still undergo professional review.
The reviewer should examine matters such as:
Ledger classifications
Current/non-current presentation
Debit and credit balances
Comparative figures
Disclosure requirements
Material adjustments
Related supporting schedules
Applicable accounting policies
Statutory requirements
Rounding and presentation consistency
The Excel template should be treated as a reporting and productivity tool, not as a substitute for accounting judgment or professional advice.
How Binarysoft Technologies Can Help
Binarysoft Technologies can assist businesses using TallyPrime with accounting-data workflows and customized reporting requirements.
Depending on the company's existing accounting setup and reporting needs, a workflow can be planned around:
TallyPrime data export
Excel data structure
Ledger mapping
Trial Balance integration
Financial statement schedules
Balance Sheet preparation
Statement of Profit and Loss preparation
Comparative figures
Validation checks
Unmapped ledger identification
Custom reporting requirements
The goal is to create a practical connection between accounting data and the financial reporting workbook.
From TallyPrime Books to Structured Financial Statements
The most efficient workflow is one where data moves systematically.
Instead of:
TallyPrime → Copy → Excel → Copy Again → Another Sheet → Manual Total → Final Report
the objective should be closer to:
TallyPrime → Structured Data → Mapping → Schedules → Financial Statements → Validation → Review
Every reduction in unnecessary manual intervention can reduce opportunities for mistakes.
Why Reusable Templates Deliver Long-Term Value
The biggest benefit may become visible in the second year.
During the first implementation, the company has to establish ledger mappings and reporting logic.
In the next reporting period, many of those mappings can potentially be reused.
Existing ledgers are already classified.
The reporting structure already exists.
Comparative columns are established.
Validation formulas are ready.
The team can focus primarily on new ledgers, changed circumstances, adjustments and updated reporting requirements.
This makes the process more scalable.
A Better Financial Reporting Workflow for 2026 and Beyond
Companies are generating more accounting data than ever, but more data does not automatically create better financial reporting.
The real improvement comes from structuring that data.
For companies in Preet Vihar and Laxmi Nagar using TallyPrime, a carefully designed Schedule III Division I Excel financial statement workbook can provide a practical reporting bridge.
Accounting transactions remain in TallyPrime.
Excel handles structured mapping, schedules, analysis and reporting.
Validation checks help identify exceptions.
Professionals review the final classifications and disclosures.
This combination can create a more efficient and controlled year-end process.
Conclusion
Preparing financial statements should not require rebuilding the same Excel workings every year.
For companies in Preet Vihar and Laxmi Nagar, integrating TallyPrime accounting data with a structured Schedule III Division I Excel Financial Statement Template can make the reporting process more organized, consistent and easier to review.
A well-planned workbook can connect the Trial Balance with ledger mappings, Balance Sheet, Statement of Profit and Loss, supporting notes, previous-year comparisons, adjustment entries and validation checks.
The strongest benefit is not simply automation.
It is control.
Finance teams can see where numbers originate, identify unmapped ledgers, reconcile reports, document adjustments and update financial statements more efficiently when TallyPrime balances change.
The final financial statements must still be reviewed according to the applicable provisions of the Companies Act, accounting standards and other relevant requirements. But the repetitive work of moving accounting information from one place to another can be significantly reduced through a structured reporting workflow.
For businesses and accounting professionals seeking to improve their TallyPrime-to-Excel financial reporting process, a customized reporting template can provide a strong foundation for faster and more systematic year-end financial statement preparation.
Powered by Binarysoft Technologies
Authorized Tally Partner
Location: 1626/33, 1st Floor, Naiwalan, Karol Bagh, New Delhi – 110005, INDIA
Contact us: +91 7428779101, 9205471661
Email us: tally@binarysoft.com
Working Hours: 10:00 AM – 6:00 PM, Mon–Fri
Frequently Asked Questions
What is a Schedule III Division I Excel Financial Statement Template?
It is a structured Excel workbook designed to help organize accounting balances and supporting information into financial statement headings and schedules relevant to Schedule III Division I reporting. The exact format and disclosures should be reviewed according to the requirements applicable to the company.
Can TallyPrime data be integrated with an Excel financial statement template?
Yes. Data exported or otherwise made available from TallyPrime can be organized in Excel and mapped to financial statement schedules. The precise integration method depends on the company's TallyPrime setup, Excel workbook design and reporting requirements.
CA. Shaurya Venkataraman specializes in business accounting, GST consultancy, and financial analysis. His articles focus on simplifying complex financial concepts and helping businesses improve operational efficiency.