Call CA Tally HelpDesk
+91 9205471661,
7428779101
What Changed in 2026? Financial Reporting Needs More Than a Year-End Excel Exercise
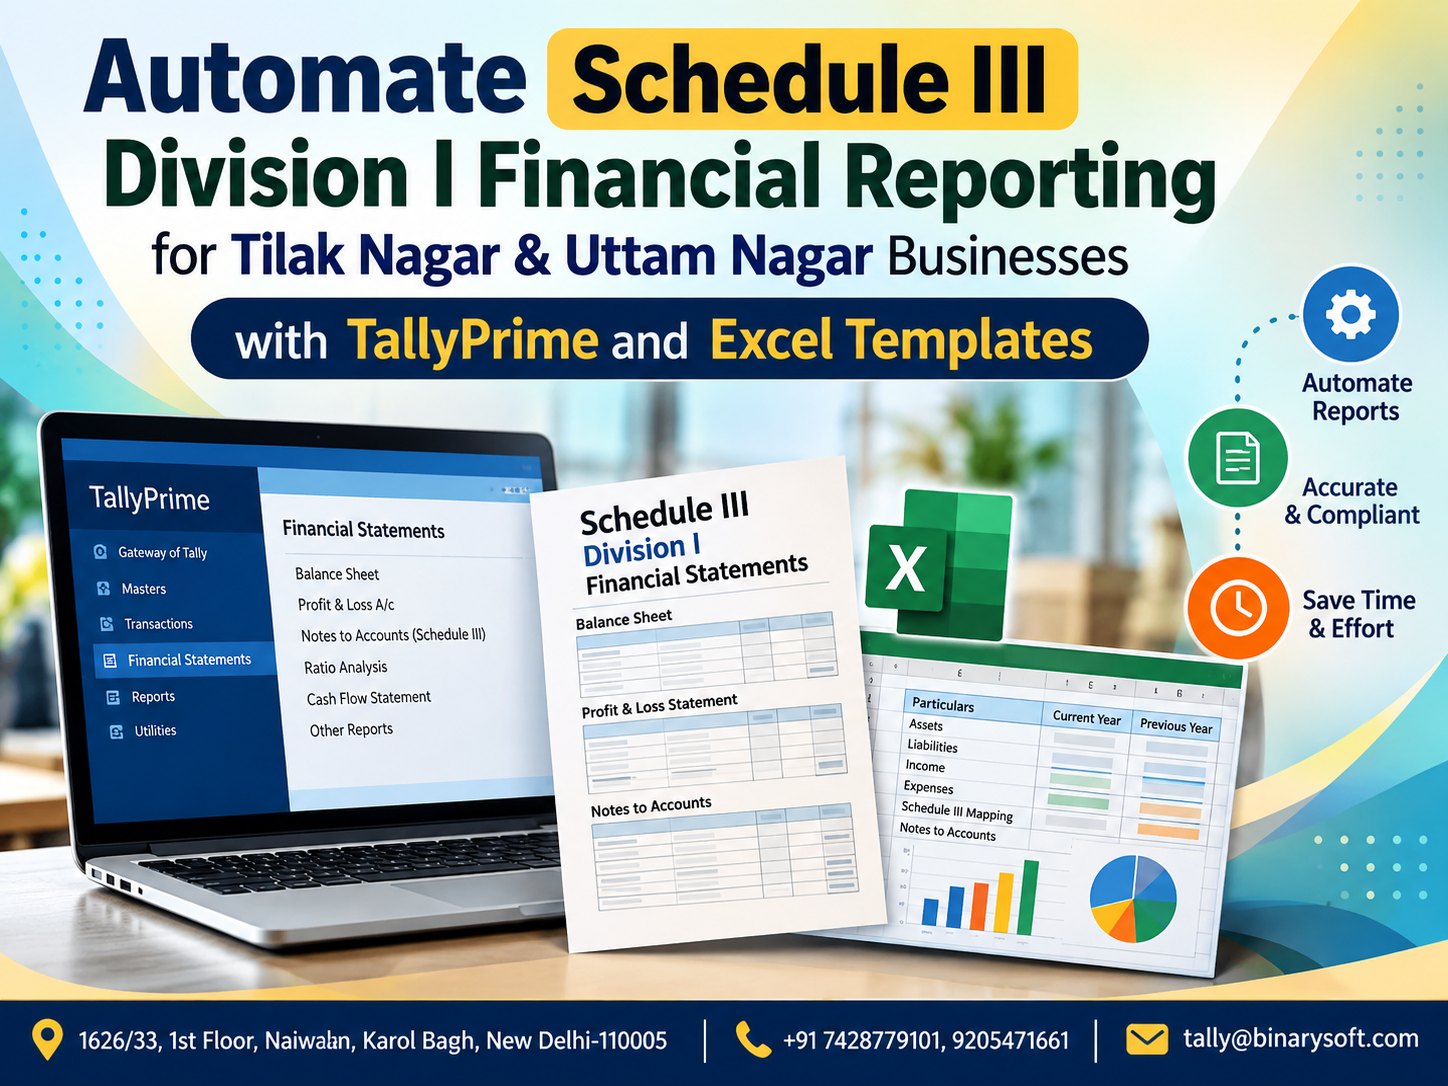
In 2026, businesses preparing financial statements under Schedule III Division I face growing pressure to turn accounting data into structured, review-ready reports without spending days manually rearranging ledgers in Excel. For applicable companies and accounting teams serving Tilak Nagar and Uttam Nagar, the challenge is rarely just extracting a Trial Balance from TallyPrime. The real work begins when ledger balances must be mapped into the correct Balance Sheet and Statement of Profit and Loss classifications, schedules, notes and comparative reporting structure. Repeating this exercise manually can increase the risk of mapping errors, broken formulas and last-minute revisions. A structured TallyPrime-to-Excel reporting workflow can make the process faster and more consistent by connecting accounting data with predefined Schedule III Division I templates. The benefit is practical: less repetitive formatting, easier review, faster revisions and more time for accountants to focus on accuracy, disclosures and final financial-statement scrutiny.
Why Schedule III Financial Reporting Needs a Better Workflow
Financial statements are among the most important outputs of an accounting system.
Throughout the year, a business may record thousands of transactions involving:
Sales
Purchases
Receipts
Payments
Expenses
Income
Assets
Liabilities
Loans
Advances
Inventory
Taxes
Bank transactions
Journal entries
At the end of the reporting period, all these transactions ultimately contribute to the financial statements.
For businesses maintaining their books in TallyPrime, much of the underlying accounting information may already be available.
The challenge is transforming that information into the required financial-statement presentation.
This is where TallyPrime and structured Excel templates can work together.
Instead of repeatedly copying balances, creating formulas and rearranging figures manually, businesses can develop a standardized workflow that maps accounting data into the required reporting structure.
What Is Schedule III Division I?
Schedule III to the Companies Act, 2013 prescribes formats and general instructions for financial statements of companies covered by its relevant divisions.
Division I broadly applies to companies whose financial statements are prepared in accordance with the Companies (Accounting Standards) Rules, 2006, subject to the applicable legal framework and company-specific circumstances.
The presentation typically involves structured financial statements and related disclosures.
Businesses should determine the exact requirements applicable to them with their Chartered Accountant, auditor or other qualified professional.
Automation should support compliance work, not replace professional judgment.
Why TallyPrime Data Alone Is Not the Final Financial Statement
This distinction is important.
TallyPrime may contain the accounting data.
But a Trial Balance is not automatically the same thing as a final Schedule III financial statement.
Imagine a Trial Balance containing hundreds of ledgers.
Those ledger balances need to be appropriately classified.
For example, depending on the facts and applicable requirements, balances may need to be considered under categories relating to:
Shareholders' funds
Non-current liabilities
Current liabilities
Property, plant and equipment
Non-current assets
Current assets
Revenue
Other income
Employee benefit expenses
Finance costs
Depreciation and amortisation
Other expenses
Tax-related items
Each company's reporting structure will depend on its accounts and applicable requirements.
This classification process is where a properly designed mapping system becomes valuable.
A Tilak Nagar Story: The Night Before the Financial Review
Consider a fictional private company operating from Tilak Nagar.
The business had grown steadily over several years.
Its accounts were maintained in TallyPrime, and the books contained hundreds of ledgers covering customers, suppliers, expenses, assets, loans, duties and taxes.
Every year, the accounts team followed the same reporting process.
First, they exported the Trial Balance.
Then they opened last year's Excel workbook.
Then the real work started.
Copy this figure.
Paste that figure.
Change this formula.
Insert a new ledger.
Check the subtotal.
Compare the previous year.
Find why the Balance Sheet is not balancing.
One year, the finance manager was preparing for an important review the following morning.
It was already after 9 PM.
Everyone else had gone home.
He changed one classification in the Excel workbook.
Suddenly, a difference appeared.
He checked one formula.
Then another.
Then another.
Almost an hour later, he discovered that a newly inserted row had not been included in one of the formulas.
The amount itself was not enormous.
But the anxiety was.
He sat back and asked a simple question:
"If all these balances already exist in Tally, why are we rebuilding the financial statements manually every year?"
That question led the company toward a more structured reporting process.
Instead of treating the Schedule III workbook as a fresh manual exercise every year, ledger mappings and reporting templates were standardized.
When balances changed, the reporting process became easier to update.
The finance team still reviewed classifications and disclosures carefully.
But they spent less time repairing spreadsheets.
The biggest benefit was not simply speed.
It was arriving at the review meeting with greater confidence in the reporting process.
The Core Problem: Trial Balance to Schedule III Mapping
One of the most time-consuming parts of financial-statement preparation is mapping accounting ledgers to appropriate reporting heads.
Suppose the Trial Balance contains:
Equity Share Capital
General Reserve
Term Loan
Working Capital Loan
Trade Creditors
Outstanding Expenses
Plant and Machinery
Office Equipment
Trade Receivables
Cash
Bank Accounts
Inventory
Sales
Other Income
Salary
Rent
Interest
Depreciation
Professional Charges
These balances may need to flow into appropriate financial-statement categories and supporting schedules.
A structured mapping table can connect each accounting ledger with its intended reporting destination.
Once mapping is established and reviewed, the process can be reused subject to changes in the ledger structure and reporting requirements.
How TallyPrime and Excel Templates Can Work Together
A practical reporting workflow may involve several stages.
Stage 1: Maintain Accurate Books in TallyPrime
Automation begins with accounting quality.
If the underlying books contain incorrect balances, duplicate ledgers or misclassified transactions, a sophisticated Excel template cannot magically correct them.
Businesses should first maintain clean accounting records.
Stage 2: Extract the Required Accounting Data
Relevant balances or reports can be exported from TallyPrime in an appropriate format.
The exact extraction method depends on the reporting solution being used.
Stage 3: Map Ledgers to Reporting Heads
A mapping sheet can define where each ledger should appear.
For example:
Tally Ledger → Reporting Head
The mapping can then become the bridge between raw accounting data and the final reporting template.
Stage 4: Populate the Excel Template
Once data is mapped, the workbook can use structured formulas, queries, macros, controlled imports or other appropriate mechanisms to populate reporting schedules.
Stage 5: Perform Review and Adjustments
The accounts team, management and professional advisers review the resulting financial statements.
Adjustments can then be incorporated into the accounting or reporting workflow as appropriate.
Stage 6: Finalize the Statements and Disclosures
The final output should be reviewed against applicable requirements before it is used for statutory reporting.
Why Tilak Nagar Businesses Can Benefit
Tilak Nagar has a diverse commercial environment comprising traders, service businesses, distributors, manufacturers and other enterprises.
As businesses grow and move toward more formal corporate structures, their financial-reporting requirements can become more demanding.
A small finance team may have to manage:
Daily accounting
GST-related work
Bank reconciliation
Receivables
Payables
Payroll entries
Audit queries
Year-end closing
Financial statements
When year-end reporting relies heavily on manual spreadsheets, workload can rise sharply.
A standardized TallyPrime-to-Excel reporting workflow can help reduce repetitive preparation work.
Why Uttam Nagar Businesses Should Consider Reporting Automation
Growing businesses in Uttam Nagar may experience a similar transition.
A company may begin with a relatively simple accounting structure.
Over time it adds:
New bank accounts
New assets
Additional loans
More customers
More suppliers
More expense categories
Additional locations
More statutory requirements
The Trial Balance becomes larger.
The financial statements become more detailed.
The number of supporting schedules increases.
A process that was manageable with 50 ledgers may become difficult with 500.
Automation can make the reporting process more scalable.
Schedule III Division I Balance Sheet Automation
The Balance Sheet presents the company's financial position as of the reporting date.
A structured Excel template can be designed to collect mapped balances into appropriate sections.
Depending on the applicable reporting requirements and the company's circumstances, these may include categories relating to equity and liabilities as well as assets.
The mapping should be carefully reviewed because presentation depends on the nature of each balance.
Automation can populate figures.
It cannot independently determine every accounting classification.
Equity and Shareholders' Funds
The reporting workflow may need to capture relevant balances relating to equity and reserves.
Changes during the reporting period should be reflected according to the applicable reporting requirements.
Because these balances can involve legal and accounting considerations, they should be reviewed carefully rather than relying solely on automated ledger names.
Non-Current Liabilities
Certain obligations may need classification as non-current depending on their nature, terms and applicable requirements.
The reporting process may therefore require more than simply mapping all loan ledgers to one heading.
Accountants should consider the underlying terms and required classifications.
This is a good example of where automation and professional judgment must work together.
Current Liabilities
Current liabilities can involve multiple categories and classifications.
Businesses may need to consider items such as trade payables, borrowings, statutory liabilities and other obligations according to applicable requirements.
The Excel reporting template can consolidate mapped balances while allowing review and adjustments.
Property, Plant and Equipment
Fixed-asset reporting can become particularly detailed.
Businesses may maintain separate asset ledgers for:
Land
Buildings
Plant and machinery
Furniture
Computers
Office equipment
Vehicles
Other assets
The reporting process may also need information relating to depreciation, additions, disposals and other movements.
Where detailed asset schedules are required, the reporting template should be designed to capture the necessary information rather than simply pulling closing balances.
Current Assets
Current assets may involve multiple categories such as inventories, receivables, cash and bank balances and other assets, depending on the company's circumstances.
The underlying ledger mapping should be maintained consistently.
If a new bank account or receivable ledger is created during the year, it should be incorporated into the mapping system.
Statement of Profit and Loss Automation
The same concept can be applied to the Statement of Profit and Loss.
TallyPrime may contain numerous income and expense ledgers.
These can be mapped into appropriate reporting categories.
For example, depending on the company's accounts:
Revenue
Other income
Purchases
Changes in inventories
Employee benefit expenses
Finance costs
Depreciation
Other expenses
Tax-related items
A structured template can aggregate multiple detailed ledgers into the relevant presentation heads.
The Power of a Ledger Mapping Master
The ledger mapping master is one of the most important components of the automation process.
Consider a company with 400 Tally ledgers.
Without mapping, every year somebody may need to decide manually where each balance belongs.
With a maintained mapping master, the company can establish a reusable classification structure.
When a new ledger appears, it can be flagged for mapping.
This creates a controlled exception process.
Instead of checking all 400 ledgers every year, the team can focus more attention on changes and exceptions.
Detecting Unmapped Ledgers
A good reporting template should not silently ignore an unfamiliar ledger.
Suppose somebody creates a new Tally ledger:
"Digital Marketing Expense"
If this ledger has never been mapped, the reporting workbook should ideally identify it as unmapped.
The user can then review the ledger and assign the appropriate reporting category.
This is much safer than allowing an unknown balance to disappear from the financial statements.
Preventing Duplicate Mapping
Another useful control is duplicate detection.
A ledger should not accidentally flow into multiple reporting heads unless the reporting logic specifically requires a deliberate allocation.
The workbook can include checks to identify unusual mapping situations.
These validation controls can improve confidence in the reporting process.
Current Year and Previous Year Comparatives
Financial statements commonly require comparative information in accordance with applicable requirements.
A well-designed template can therefore include columns for current-period and previous-period figures.
This can make comparison easier and reduce the need to manually insert prior-year numbers repeatedly.
It also helps reviewers identify significant movements.
For example:
Sales increased substantially.
Receivables increased faster than sales.
Inventory declined.
Borrowings increased.
Finance costs changed.
Operating expenses rose.
These movements can then be investigated.
Automated Totals and Subtotals
One of the simplest but most valuable benefits of Excel automation is controlled calculation.
Manual spreadsheets are vulnerable to formula errors.
Someone inserts a row.
A SUM formula does not expand.
A figure is pasted over a formula.
A cell reference points to the wrong schedule.
A structured template can reduce these risks through consistent formulas and controlled input areas.
The workbook should still be reviewed, but the calculation framework becomes more repeatable.
Balance Sheet Validation
A fundamental check is whether the financial statement balances according to its accounting structure.
A reporting workbook can include validation controls that highlight differences requiring investigation.
This does not explain the cause automatically, but it gives the finance team an immediate warning.
A visible difference indicator is much better than discovering the issue during the final review.
Trial Balance Reconciliation
One of the most important controls is reconciliation between the source Trial Balance and mapped reporting data.
The process should allow users to verify that relevant balances have been accounted for within the reporting structure.
A control sheet may compare:
Source balances
Mapped balances
Unmapped balances
Adjustments
Final reporting values
This creates an audit trail for the preparation process.
Notes to Financial Statements
Schedule III reporting involves more than the face of the Balance Sheet and Statement of Profit and Loss.
Supporting notes and disclosures can form a significant part of the financial statements.
A well-designed Excel workbook can include structured schedules linked to the main statements.
Where appropriate, totals from detailed schedules can flow automatically into the main financial statements.
This reduces repeated copying.
Why Notes Cannot Be Fully Automated
Not every disclosure comes directly from the Trial Balance.
Some disclosures require additional information, analysis, contractual details, management inputs or professional judgment.
Therefore, the objective should not be to automate every sentence in the financial statements.
A better model is:
Automate repeatable numerical work.
Structure manual inputs.
Highlight missing information.
Apply validation controls.
Leave judgment-based matters for professional review.
Trade Receivables Reporting
Trade receivables may require more detailed analysis than simply showing one closing balance.
Depending on applicable requirements, companies may need additional classification or ageing-related information.
If such reporting is required, the necessary underlying data must be available in a usable structure.
An Excel template can organize and present the information, but the quality of the result depends on the source data.
Trade Payables Reporting
Trade payables may also require detailed analysis and disclosures depending on the applicable framework.
Businesses should ensure that supplier records, balances and classifications are properly maintained.
Where required information is available, Excel templates can help organize reporting schedules and connect totals with the main financial statements.
Inventory Reporting
For trading and manufacturing companies, inventory can represent a significant portion of current assets.
Different categories may need to be considered according to the nature of the business and applicable reporting requirements.
A structured reporting workbook can provide designated sections for relevant inventory categories and link their totals appropriately.
The source values should be reconciled with the underlying accounting and inventory records.
Borrowing Schedules
Borrowings often require more than a single figure.
Different facilities may have different terms, security arrangements, repayment structures and classifications.
Therefore, loan reporting should not be automated purely based on ledger names.
A structured Excel schedule can combine imported balances with controlled manual information required for disclosures.
Fixed Asset and Depreciation Schedules
Asset reporting is another area where structured Excel templates can save significant preparation time.
The schedule may track:
Opening values
Additions
Disposals
Closing values
Accumulated depreciation
Current-period depreciation
Other relevant movements
The exact structure should match the company's applicable reporting requirements.
Cash and Bank Balances
Companies may maintain multiple bank accounts.
Rather than manually typing each balance into a reporting schedule, mapped accounting data can populate the relevant sections.
However, bank reconciliation should be completed separately to ensure the accounting balances themselves are accurate.
Reporting automation does not replace reconciliation.
GST and Other Statutory Ledgers
Businesses may have numerous statutory ledgers in TallyPrime.
Before final reporting, these balances should be reviewed and appropriately classified.
Unusual debit or credit balances should not simply be accepted because an automated formula placed them somewhere.
Exception review remains essential.
How Excel Templates Improve the Review Process
A good template is not merely a prettier financial statement.
It should help the reviewer understand how the figures were produced.
Useful workbook sections can include:
Source data
Ledger mapping
Current-year Trial Balance
Previous-year data
Adjustments
Balance Sheet
Statement of Profit and Loss
Supporting schedules
Disclosure inputs
Validation checks
Unmapped-ledger report
Control totals
This makes the workbook a reporting system rather than a collection of disconnected sheets.
Version Control Matters
One common problem during financial-statement preparation is file duplication.
You may see files named:
Final.xlsx
Final_New.xlsx
Final_Updated.xlsx
Final_Updated_2.xlsx
Final_CA.xlsx
Final_CA_Revised.xlsx
Final_Actual.xlsx
Nobody is completely sure which one is current.
A controlled reporting process should establish clear version management and responsibility.
Where possible, businesses should reduce unnecessary copies and maintain a clear master workbook.
Protecting Formulas
Important formula cells can be protected to reduce accidental overwriting.
Input areas can be separated from calculation areas.
This makes the workbook safer for multiple users.
Color coding or other clear formatting can also distinguish:
Imported data
Manual inputs
Calculated fields
Review items
Errors
However, formatting should support clarity rather than making the workbook unnecessarily complicated.
Benefits for Chartered Accountants and Finance Teams
Schedule III automation can change how professionals spend their time.
Without structured automation, significant time may go into:
Copying figures
Updating formulas
Finding broken links
Rearranging schedules
Comparing versions
Checking totals repeatedly
With a better workflow, more time can be spent on:
Accounting classification
Disclosure review
Analytical review
Reconciliation
Audit observations
Financial interpretation
Compliance
This is a much higher-value use of professional expertise.
Faster Revision After Audit Adjustments
Year-end accounts rarely remain unchanged after the first draft.
Auditors may propose adjustments.
Management may correct provisions.
Depreciation may change.
Expenses may be reclassified.
Balances may be reconciled.
If the financial statements are heavily dependent on manually typed figures, every adjustment can require changes in multiple places.
A linked reporting model can reduce this problem.
When the source figure or adjustment is updated, related schedules and totals can be designed to update accordingly.
This can make revision cycles significantly easier.
Why Automation Does Not Replace the Auditor or Chartered Accountant
This point is essential.
A TallyPrime-to-Excel reporting solution is a productivity and reporting tool.
It does not independently determine whether every accounting treatment is correct.
It cannot replace professional judgment regarding:
Accounting policies
Recognition
Measurement
Classification
Materiality
Disclosures
Legal requirements
Audit procedures
Tax treatment
The final financial statements should be reviewed by appropriately qualified professionals based on the company's applicable requirements.
Building a Repeatable Year-End Process
The greatest benefit of automation appears over multiple reporting periods.
In the first year, the business creates:
Mappings
Templates
Validation rules
Schedules
Controls
Processes
In the next year, much of that structure can potentially be reused and updated.
Instead of starting from zero, the finance team begins with an established framework.
That can reduce year-end pressure significantly.
TallyPrime to Schedule III Reporting for Tilak Nagar Businesses
Companies and professional accounting teams serving Tilak Nagar can use a structured TallyPrime and Excel workflow to reduce repetitive financial-statement preparation.
This can be particularly valuable for businesses with:
Large Trial Balances
Numerous ledgers
Multiple expense categories
Detailed asset schedules
Several loans
Large receivable and payable bases
Frequent audit adjustments
Comparative reporting requirements
The greater the complexity, the more valuable a controlled reporting structure can become.
TallyPrime to Schedule III Reporting for Uttam Nagar Businesses
Growing companies in Uttam Nagar may also benefit from standardizing their year-end financial reporting.
Instead of depending on one employee who understands a complicated spreadsheet, the organization can document mappings and create a repeatable reporting process.
This reduces key-person dependency and improves continuity.
When staff changes occur, the reporting logic remains documented within the system.
Moving from Manual Financial Statements to a Reporting System
There is an important difference between an Excel file and an Excel-based reporting system.
An ordinary Excel file may contain figures.
A reporting system contains:
Defined inputs
Mapping logic
Controlled calculations
Reconciliations
Validation checks
Schedules
Exception reports
Comparatives
Review points
Documented processes
This is the direction businesses should consider when automating Schedule III financial reporting.
What Businesses Should Prepare Before Automation
Before developing the reporting template, gather the necessary information.
This may include:
Current Trial Balance
Previous-year Trial Balance
Existing financial statements
Chart of accounts
Ledger list
Existing Schedule III workbook
Fixed asset information
Borrowing details
Receivable information
Payable information
Inventory information
Required disclosures
Audit adjustment process
The better the initial information, the more accurately the reporting workflow can be designed.
Implementation Approach
A practical implementation can be divided into phases.
First, understand the existing financial-statement preparation process.
Second, identify the source data available from TallyPrime.
Third, define the Schedule III reporting structure required for the company.
Fourth, create the ledger mapping.
Fifth, develop the Excel template and calculations.
Sixth, test using actual or controlled sample data.
Seventh, compare the automated output with previously reviewed financial statements.
Eighth, resolve mapping differences.
Ninth, document the workflow.
Finally, train the relevant users.
This phased approach can reduce implementation risk.
The Real Goal Is Not Just Faster Excel
It is easy to think that Schedule III automation simply means creating a more advanced spreadsheet.
That misses the larger opportunity.
The real objective is to create a controlled bridge between accounting data and financial reporting.
TallyPrime holds the underlying books.
Excel can provide a flexible reporting and presentation layer.
Mapping connects the two.
Validation checks protect the process.
Professional review ensures that the final statements appropriately reflect the company's financial information and applicable requirements.
When these elements work together, year-end reporting can become more structured, repeatable and manageable.
Conclusion
Preparing Schedule III Division I financial statements can be one of the most demanding parts of the year-end accounting process, particularly for companies with large Trial Balances, numerous ledgers and extensive supporting schedules.
For businesses and accounting teams in Tilak Nagar and Uttam Nagar, manually exporting TallyPrime data and rebuilding financial statements in Excel every year can consume valuable time and increase the risk of formula errors, missed ledgers, incorrect mappings and version-control problems.
A structured TallyPrime-to-Excel reporting solution can help automate the repetitive parts of this process.
Ledger balances can be mapped to defined reporting heads.
Current-year and comparative figures can be organized.
Schedules can be linked.
Totals can be calculated consistently.
Unmapped ledgers can be highlighted.
Control checks can identify differences.
Audit adjustments can be incorporated more efficiently.
The result is not "automatic compliance." Professional review remains essential for accounting classifications, disclosures and applicable statutory requirements.
The real benefit is a stronger reporting process.
Instead of accountants spending hours copying figures from one file to another, they can focus on the areas where their expertise creates the greatest value: reconciliation, classification, disclosures, analysis and review.
For growing businesses, that can turn Schedule III preparation from a stressful year-end spreadsheet exercise into a more organized, repeatable and controlled financial-reporting workflow.
Schedule III Division I Reporting Solutions from Binarysoft Technologies
Binarysoft Technologies can assist businesses looking to streamline TallyPrime-to-Excel financial reporting workflows.
The reporting solution can be evaluated according to your existing TallyPrime ledger structure, Trial Balance, financial-statement format, Excel reporting requirements, comparative figures, schedules and review process.
Requirements can include ledger mapping, Trial Balance processing, Balance Sheet reporting, Statement of Profit and Loss reporting, supporting schedules, comparative figures, validation checks and customized Excel templates.
Powered by Binarysoft Technologies
Authorized Tally Partner
Location: 1626/33, 1st Floor, Naiwalan, Karol Bagh, New Delhi – 110005, INDIA
Contact us: +91 7428779101, 9205471661
Email us: tally@binarysoft.com
Working Hours: 10:00 AM – 6:00 PM, Mon–Fri
Frequently Asked Questions
What is Schedule III Division I financial reporting?
Schedule III Division I provides a financial-statement presentation framework for companies to which that division applies under the relevant Companies Act and accounting requirements. Applicability and specific disclosures should be confirmed with a qualified professional.
Can TallyPrime data be used for Schedule III financial statements?
TallyPrime accounting data can provide the underlying balances required for financial reporting. Those balances still need to be appropriately mapped, classified, reviewed and presented according to applicable requirements.
CA. Arinav Chakraborty advises businesses on taxation, accounting systems, and financial planning. His professional interests include digital transformation, compliance management, and improving business efficiency through technology.