Call CA Tally HelpDesk
+91 9205471661,
7428779101
Introduction: Why Every Growing Business Needs Better Financial Visibility
Running a successful business requires more than recording sales, purchases and expenses.
Business owners must understand what their financial information means.
Are sales increasing while profits decline? Which products generate the highest revenue? Are customers paying invoices on time? Is inventory moving efficiently? Will sufficient cash be available to meet upcoming expenses?
These questions become increasingly important as an organisation grows.
Unfortunately, many businesses maintain large amounts of accounting information without converting it into meaningful insights.
Managers often depend on spreadsheets, manually prepared summaries and reports collected from different departments.
By the time the information reaches decision-makers, it may already be outdated.
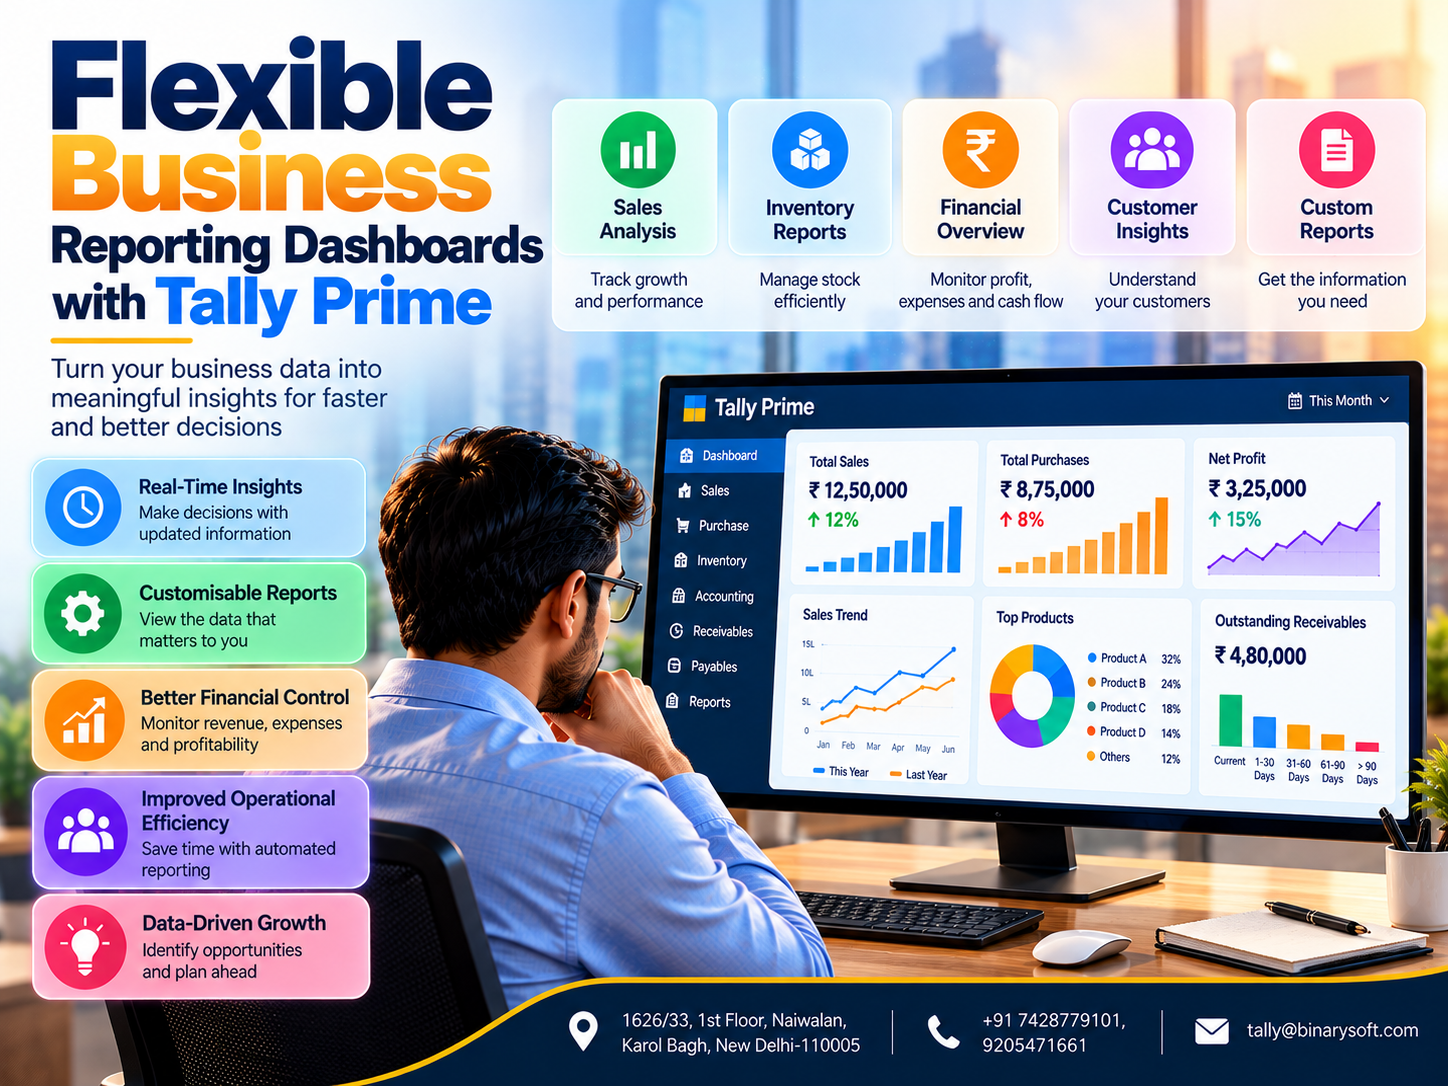
Flexible business reporting dashboards help solve this problem by organising important information into accessible, understandable views.
A well-designed dashboard can highlight financial performance, operational trends and areas requiring management attention.
Tally Prime provides accounting, inventory and financial reporting capabilities that help businesses examine their operations.
When appropriate, its information can also support externally developed business intelligence dashboards through supported data exchange methods.
This article explores how flexible reporting improves decision-making, which business metrics matter most and how organisations can use Tally Prime to strengthen financial visibility.
1. An Emotional Story: The Business Owner Who Discovered the Truth Behind Rising Sales
Rohit operated a garment distribution business in Delhi.
His father had started the company with a small shop and a handful of loyal customers.
Over the years, Rohit expanded operations, hired additional employees and began supplying retailers across northern India.
Sales increased steadily.
Everyone believed the company was performing exceptionally well.
However, Rohit noticed something troubling.
Despite rising revenue, the business frequently struggled to pay suppliers on time.
Employees requested additional working capital, and inventory continued accumulating in the warehouse.
One evening, Rohit received a call from a supplier who had supported the family business for more than fifteen years.
The supplier politely explained that repeated payment delays were affecting his own operations.
Rohit felt embarrassed.
His father had always taught him that business relationships depended on trust.
He could not understand why a company generating strong sales was facing financial pressure.
The following morning, Rohit asked his accountant to prepare a detailed review.
Instead of examining revenue alone, they studied outstanding receivables, inventory balances, expenses and cash flow.
The findings surprised him.
Several major customers were taking longer to pay.
Slow-moving products were occupying valuable warehouse space.
Transportation expenses had also increased.
Revenue growth had concealed important operational problems.
Rohit introduced a structured management reporting process.
Every week, the team reviewed sales, receivables, stock movement and available cash.
Management began following up on overdue invoices and improving purchasing decisions.
Gradually, the company gained better financial control.
Rohit realised that the problem had never been a lack of information.
The problem was that nobody had been looking at the information together.
His experience demonstrated an important business lesson: growing sales do not always mean improving financial health.
This fictional story illustrates why business reporting should connect financial performance with operational reality.
2. What Are Flexible Business Reporting Dashboards?
A business reporting dashboard is a structured display of selected business information.
It presents important performance indicators, summaries, trends and comparisons in a format designed to support decision-making.
A flexible dashboard allows organisations to adjust the information displayed according to business requirements.
For example, a sales manager may need customer-wise revenue and monthly sales comparisons.
An accountant may prioritise receivables, payables and cash flow.
A warehouse manager may focus on stock availability and inventory movement.
A business owner may require a consolidated overview of financial and operational performance.
Common Dashboard Components
A dashboard should help users understand business conditions quickly without replacing the detailed records behind the figures.
3. Why Traditional Business Reporting Can Become Inefficient
Traditional reporting often requires employees to collect information manually.
Data may be exported from accounting applications, combined in spreadsheets and distributed through email.
Although this approach can work, it creates several challenges.
Repeated Manual Work
Employees may spend hours preparing similar reports.
Inconsistent Information
Different departments may use different reporting periods or calculations.
Delayed Decisions
Management may receive important information after the opportunity to act has passed.
Limited Visibility
Reports prepared for one department may overlook problems affecting another.
Spreadsheet Errors
Manual formulas and data transfers can introduce mistakes.
Difficult Comparisons
Historical trends may be difficult to identify when information is spread across separate files.
Flexible reporting reduces these difficulties when supported by accurate source data, consistent definitions and suitable reporting tools.
4. Understanding Different Types of Business Dashboards
Not every dashboard serves the same purpose.
Businesses should select reporting views according to the decisions they need to make.
Financial Dashboards
Financial dashboards focus on revenue, expenses, profitability, receivables, payables and cash flow.
They help management evaluate financial performance.
Sales Dashboards
Sales dashboards examine customer purchases, product performance, sales trends and revenue targets.
They support sales planning and performance reviews.
Inventory Dashboards
Inventory dashboards focus on stock availability, inventory movement, reorder requirements and slow-moving products.
They help businesses improve purchasing and stock control.
Operational Dashboards
Operational dashboards examine activities such as order processing, delivery performance and resource utilisation.
These may require information from systems beyond accounting software.
Executive Dashboards
Executive dashboards combine selected indicators from multiple departments.
They help senior management understand overall business performance.
The most effective dashboard is not necessarily the one containing the largest number of charts.
It is the one that answers important business questions clearly.
5. Key Features of an Effective Reporting Dashboard
Flexible Report Selection
Users should be able to select the information relevant to their responsibilities.
Date Filters
Reporting periods should be clearly defined.
Monthly, quarterly and annual comparisons can reveal important trends.
Drill-Down Capabilities
Where supported, users should be able to examine the transactions behind summary figures.
Consistent Calculations
Revenue, profit and outstanding balances should follow clearly documented definitions.
Visual Clarity
Charts and tables should communicate information without unnecessary complexity.
Appropriate Access Control
Sensitive financial information should be available only to authorised users.
Data Refresh Information
Users should understand when the displayed information was last updated.
Export Options
Reports may need to be exported for review, audit or management discussions.
These features make dashboards more useful and dependable.
6. How Tally Prime Supports Business Reporting
Tally Prime provides several reports that help businesses examine accounting and operational performance.
These capabilities can form the foundation of a structured reporting process.
Balance Sheet
The Balance Sheet provides information about assets, liabilities and financial position.
Profit and Loss Account
This report helps businesses review income, expenses and profitability.
Cash Flow Statement
Cash flow reporting helps management understand movements in cash and cash equivalents.
Sales Register
Businesses can examine recorded sales transactions and related information.
Purchase Register
Purchase reporting supports supplier and procurement analysis.
Outstanding Receivables
Receivables reports help identify customer balances requiring attention.
Outstanding Payables
Payables reports support supplier payment planning.
Stock Summary
Inventory reports help businesses review stock quantities and values.
Ledger Reports
Ledger information provides detailed transaction histories.
Tally Prime also offers its own reporting and analysis capabilities, including configurable views within supported reports.
A fully customised, cross-application graphical dashboard may require an external reporting solution.
7. Sales Dashboards: Understanding Revenue Beyond the Total
Sales figures are important, but total revenue alone rarely explains business performance.
A useful sales dashboard can answer several questions.
Which customers generate the highest revenue?
Which products are growing fastest?
Are sales concentrated among a small number of customers?
How does current performance compare with previous periods?
Important Sales Indicators
Total Sales: Revenue recorded during the selected period.
Sales Growth: Percentage change compared with an earlier period.
Customer-Wise Sales: Revenue contribution from individual customers.
Product-Wise Sales: Performance of different product categories.
Monthly Sales Trends: Changes in revenue over time.
Sales Returns: Value of returned or reversed sales.
Tally Prime sales reports can provide relevant accounting information.
External dashboard tools can create additional visualisations when data is exchanged through suitable methods.
8. Inventory Dashboards: Improving Stock Accuracy and Working Capital
Inventory is one of the largest investments for many trading and manufacturing businesses.
Excess inventory can restrict cash flow.
Insufficient inventory can result in lost sales.
An inventory dashboard helps management balance these risks.
Stock Availability
Review quantities available for sale or production.
Stock Valuation
Understand the financial value of inventory.
Product Movement
Identify products with high or low transaction activity.
Reorder Planning
Use inventory information to support purchasing decisions.
Warehouse Comparisons
Review location-wise stock information where properly configured.
Slow-Moving Inventory
Identify products that may require further investigation.
Tally Prime provides stock reports and inventory management features that can support these activities.
More advanced indicators may require additional calculations or external analytical tools.
9. Cash Flow Dashboards: Understanding the Financial Health of a Business
A profitable business can still experience cash shortages.
This happens when cash receipts and payment obligations do not align.
For example, a company may record substantial sales on credit but receive customer payments several months later.
Meanwhile, salaries, rent and supplier payments must continue.
A cash flow dashboard helps management examine these timing differences.
Important Cash Flow Indicators
Management can use this information to plan payment commitments and working capital requirements.
Tally Prime provides relevant accounting reports.
Forward-looking cash flow forecasts may require additional assumptions and planning models.
10. Case Study One: A Wholesale Distributor Improves Financial Visibility
Illustrative case study
A wholesale distributor supplied electrical products to retailers across three cities.
The company maintained accounting and inventory records in Tally Prime.
The Challenge
Management reviewed sales regularly but rarely examined customer outstanding balances and stock movement together.
As a result, the company occasionally experienced cash shortages despite increasing revenue.
The Solution
The business introduced a weekly reporting process.
Management reviewed sales, customer receivables, inventory values and cash flow information.
Selected reports were consolidated into a management dashboard.
Employees also received responsibility for investigating overdue balances.
Illustrative Results
During a three-month evaluation, management estimated a 20% reduction in overdue receivables within the customer group targeted for follow-up.
The company also improved purchasing discussions by reviewing inventory information more regularly.
Key Learning
Combining sales, receivables and inventory reporting provides a clearer understanding of business performance than examining revenue alone.
11. Case Study Two: A Manufacturing Company Reduces Reporting Delays
Illustrative case study
A manufacturing company operated several production and distribution departments.
Its management team required regular information about sales, expenses, stock and profitability.
The Challenge
Employees manually combined reports from multiple sources.
Monthly reporting required considerable administrative effort.
Different departments occasionally used inconsistent reporting periods.
The Solution
The company standardised reporting definitions and established a structured dashboard.
Tally Prime supplied relevant accounting and inventory information.
Additional operational information was incorporated through controlled reporting processes.
Illustrative Results
During the evaluation period, management estimated a 35% reduction in time spent preparing recurring management reports.
Departmental discussions became more focused because teams reviewed consistent figures.
Key Learning
Reporting efficiency depends on both suitable technology and clearly defined business processes.
12. How Flexible Dashboards Support Better Management Decisions
Dashboards are valuable when they help businesses take action.
Suppose a sales dashboard shows increasing revenue but declining margins.
Management can investigate product pricing, discounts and expenses.
If an inventory dashboard shows rising stock values, the purchasing team can review slow-moving products.
If receivables are increasing faster than sales, the accounts department can examine collection procedures.
These examples demonstrate the importance of connecting reports to decisions.
A Practical Decision-Making Process
First, identify an unusual trend.
Next, examine the underlying transactions.
Then, investigate possible causes.
After that, select an appropriate corrective action.
Finally, review subsequent reports to determine whether the action was effective.
Dashboards should support this process rather than encourage decisions based on isolated numbers.
13. Real-Time Reporting vs Periodic Reporting
The term real-time reporting is often used broadly.
However, businesses should understand how frequently information is actually updated.
Real-Time Reporting
Information reflects changes with minimal processing delay.
Near-Real-Time Reporting
Information updates frequently but may have a measurable delay.
Scheduled Reporting
Information refreshes at defined intervals.
Manual Reporting
Employees export or prepare reports when required.
Tally Prime provides access to current recorded information within its operating environment.
An external dashboard's freshness depends on its integration method and refresh schedule.
Businesses should not assume that every dashboard connected to accounting software updates instantly.
For many management activities, daily or hourly reporting may be sufficient.
The correct refresh frequency depends on the decisions being supported.
14. Building a Custom Dashboard Using Tally Prime Data
Businesses requiring customised visual dashboards can evaluate external reporting tools.
A typical implementation includes several stages.
Step 1: Define Business Requirements
Identify the questions management wants the dashboard to answer.
Step 2: Select Key Performance Indicators
Choose relevant metrics such as sales growth, receivables, inventory value and cash flow.
Step 3: Identify Data Sources
Determine which information is available in Tally Prime and which requires other applications.
Step 4: Select a Supported Data Exchange Method
Evaluate available exports, integrations and supported interfaces.
Step 5: Prepare the Data
Validate account mappings, dates, units and transaction classifications.
Step 6: Build the Reporting Model
Create consistent calculations and relationships between datasets.
Step 7: Design the Dashboard
Use charts, tables and summary indicators appropriate to the intended users.
Step 8: Configure Security
Restrict access according to employee responsibilities.
Step 9: Validate Results
Compare dashboard figures with the original accounting reports.
Step 10: Establish Maintenance Procedures
Monitor data refreshes, calculation changes and integration failures.
This process helps businesses create useful reporting environments without compromising accounting accuracy.
15. Common Dashboard Design Mistakes
Displaying Too Many Metrics
Excessive information makes it difficult to identify important trends.
Using Inconsistent Definitions
Different calculations for the same metric can create confusion.
Ignoring Data Quality
Incorrect source records produce misleading reports.
Overusing Charts
Not every business question requires a graphical display.
Hiding Reporting Dates
Users must know which period the information represents.
Neglecting Security
Sensitive financial information should not be unnecessarily exposed.
Failing to Validate Calculations
Dashboard totals should be reconciled with authoritative accounting reports.
Treating Dashboards as Automatic Solutions
A dashboard cannot correct poor business processes without appropriate action.
Avoiding these mistakes improves reporting quality.
16. Security and Data Governance in Business Reporting
Financial dashboards may contain confidential information.
Businesses should establish clear controls for data access and handling.
Role-Based Permissions
Users should receive access according to their responsibilities.
Secure Data Transfer
Information should move through appropriate protected channels.
Data Minimisation
Dashboards should contain only the information necessary for their purpose.
Auditability
Important changes to reporting definitions should be documented.
Backup and Recovery
Reporting configurations and relevant data should be protected.
Access Reviews
Permissions should be reviewed when employees change roles or leave the organisation.
Data Retention
Businesses should establish appropriate retention procedures.
A reporting dashboard should improve information availability without weakening financial confidentiality.
17. Measuring the Success of a Reporting Dashboard
Businesses should evaluate whether dashboards improve decision-making and operational efficiency.
Useful indicators include:
| Performance Indicator | Business Purpose |
|---|
| Report Preparation Time |
Measures reporting efficiency |
| Data Accuracy |
Evaluates consistency with source records |
| Dashboard Adoption |
Indicates whether employees use the reports |
| Receivables Ageing |
Helps assess collection performance |
| Inventory Turnover |
Supports inventory efficiency analysis |
| Gross Profit Margin |
Helps evaluate trading profitability |
| Cash Conversion Cycle |
Supports working capital analysis |
| Reporting Refresh Delay |
Measures information freshness |
These indicators should be interpreted in context.
For example, a reduction in report preparation time is valuable only if reporting accuracy remains dependable.
18. The Future of Flexible Business Reporting
Business reporting is becoming increasingly connected and accessible.
Organisations are adopting systems that combine financial, operational and customer information.
Cloud-based reporting environments can support distributed management teams.
Automated data pipelines may reduce repetitive reporting work.
Artificial intelligence may assist with identifying unusual patterns, forecasting outcomes and generating analytical summaries.
However, automated insights still require validation.
Incorrect source information or unsuitable assumptions can produce misleading recommendations.
Businesses should maintain strong accounting controls and clear responsibility for financial decisions.
Tally Prime can continue serving as an important source of accounting and inventory information within a broader reporting environment.
The most effective reporting strategy combines reliable data, useful technology and informed human judgement.
Conclusion
Flexible business reporting dashboards help organisations convert financial and operational information into practical insights.
By combining sales, expenses, receivables, inventory and cash flow information, businesses can understand performance more clearly.
Dashboards can reduce repetitive reporting work, highlight important trends and support better management discussions.
Tally Prime provides accounting and inventory reports that form a useful foundation for financial analysis.
Businesses requiring advanced graphical dashboards can evaluate suitable external reporting solutions and supported integration methods.
However, successful reporting depends on accurate records, consistent calculations, appropriate security and regular management review.
The purpose of a business dashboard is not simply to display impressive charts. It is to help decision-makers understand what is happening, why it matters and what action should come next.
Powered by Binarysoft Technologies
Authorized Tally Partner
Location: 1626/33, 1st Floor, Naiwalan, Karol Bagh, New Delhi – 110005, INDIA
Contact Us: +91 7428779101, 9205471661
Email: tally@binarysoft.com
Business Hours: 10:00 AM – 6:00 PM, Monday to Friday
Binarysoft Technologies helps businesses implement Tally Prime, improve accounting workflows, manage inventory and evaluate suitable reporting solutions for better financial visibility.
Frequently Asked Questions
Are business dashboards always updated in real time?
No. Information freshness depends on the source application, integration method and refresh schedule.
How can businesses protect confidential dashboard information?
They should use appropriate access permissions, secure data transfer, controlled sharing and regular access reviews.
How can a business start using flexible reporting dashboards?
Start by identifying important business questions, reviewing existing Tally Prime reports and evaluating whether additional dashboard capabilities are necessary.
What is the difference between a dashboard and a financial report?
A financial report presents detailed information for a particular purpose. A dashboard typically combines selected indicators and summaries to support quick analysis.
CA. Naksh Bafna works on bookkeeping, financial controls, and taxation for small and growing enterprises. His focus is on making accounting processes systematic, understandable, and easier to manage throughout the financial year.