Call CA Tally HelpDesk
+91 9205471661,
7428779101
Introduction: Turning Complicated Business Numbers into Meaningful Insights
Every business generates information.
Sales invoices, purchase transactions, customer payments, supplier balances, inventory movements, operating expenses and financial statements create enormous amounts of data.
For a small business, this information may be manageable initially.
However, as operations expand, understanding the complete financial picture becomes increasingly difficult.
A retailer may sell hundreds of products daily.
A distributor may manage thousands of customer transactions.
A manufacturer may need to monitor raw materials, finished goods, production expenses and outstanding payments.
Although these records contain valuable information, reviewing them individually can consume considerable time.
Business owners need a way to understand what the numbers mean without examining every transaction.
This is where business dashboards become valuable.
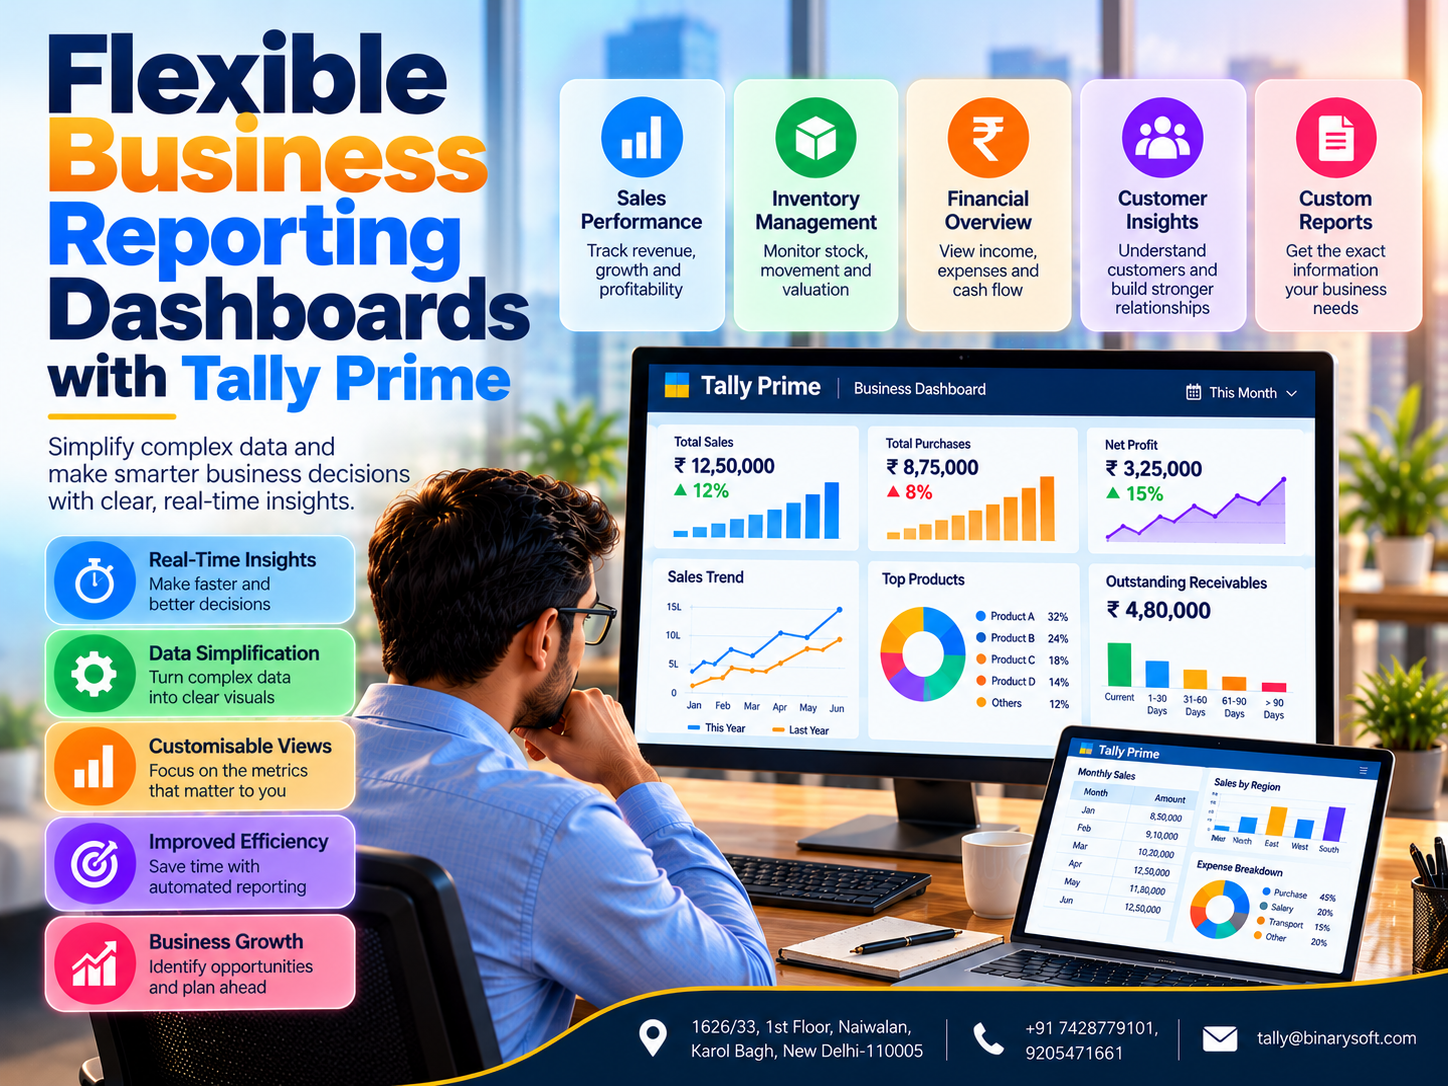
A dashboard presents important business information through summaries, charts, indicators and comparisons.
Instead of searching through lengthy reports, managers can quickly identify changes in sales, profitability, inventory and cash flow.
Tally Prime provides accounting, inventory and financial reporting capabilities that help businesses understand their operations.
Its reporting features can also provide information for separately developed dashboards when appropriate integration or export methods are available.
The objective is not simply to make financial information look attractive.
It is to transform complex data into practical knowledge that supports better decisions.
1. An Emotional Story: The Night a Business Owner Finally Understood His Numbers
Sanjay owned a family-run wholesale business in Delhi.
His father had started the company with a small rented shop and limited capital.
Over the years, the business expanded into a large distribution operation supplying products to retailers across several cities.
Sanjay worked tirelessly.
He arrived early, supervised employees, met customers and reviewed sales every evening.
His accounting team maintained detailed financial records.
Yet something troubled him.
Despite increasing revenue, the company frequently struggled to maintain sufficient cash.
Supplier payments were delayed.
Warehouse space was becoming expensive.
Employees regularly requested additional working capital.
One evening, Sanjay sat alone in his office after everyone had left.
He opened several spreadsheets containing sales, purchases, expenses and outstanding balances.
The numbers were everywhere.
But the answers were nowhere.
He remembered his father's advice:
"Never judge a business only by how much it sells. Understand how much it earns and how much money remains available."
Sanjay realised that he had been concentrating on revenue while overlooking other important indicators.
The following week, he worked with his accountant to establish a simple management dashboard.
They combined sales trends, customer receivables, stock values, expenses and cash flow information.
The results revealed several problems.
Some high-volume products generated relatively low margins.
A significant amount of working capital was tied up in slow-moving inventory.
Several customers had accumulated overdue balances.
Transportation expenses had increased without receiving sufficient management attention.
For the first time, Sanjay could see how different business activities affected one another.
He introduced weekly reviews and assigned employees responsibility for investigating important changes.
Over time, the company improved its financial discipline.
Sanjay learned that financial information becomes powerful only when people can understand and act upon it.
A business dashboard did not create new money for his company. It helped him recognise where existing money was being delayed, consumed or underutilised.
This fictional story illustrates the importance of turning accounting information into meaningful business insights.
2. What Is a Business Dashboard?
A business dashboard is a visual or structured reporting interface that displays selected business information in one place.
It helps users monitor performance, identify trends and investigate important changes.
Dashboards may contain charts, tables, financial summaries and key performance indicators.
For example, a dashboard might display monthly sales, outstanding receivables, inventory values and operating expenses.
A business owner can review these figures together rather than opening separate reports repeatedly.
Common Dashboard Components
Key Performance Indicators: Important measurements such as revenue, profit margin and receivables.
Charts: Visual representations of trends and comparisons.
Summary Tables: Consolidated information about customers, products or departments.
Filters: Options to select dates, categories or business units.
Comparative Reports: Information comparing current performance with previous periods.
Alerts: Notifications or visual indicators highlighting unusual conditions, where supported.
The best dashboards focus on information relevant to the decisions users need to make.
3. Why Complex Business Data Creates Challenges
Business data becomes difficult to manage when information is distributed across multiple reports and applications.
Large Transaction Volumes
Growing businesses generate increasing numbers of financial records.
Disconnected Information
Sales, accounting, inventory and customer information may be maintained separately.
Manual Reporting
Employees may spend hours combining spreadsheets.
Delayed Analysis
Management may receive important information after a problem has already developed.
Inconsistent Calculations
Different departments may calculate business indicators differently.
Limited Visibility
Individual reports may not reveal relationships between revenue, expenses and cash flow.
Dashboards help address these challenges by presenting selected information in a consistent format.
However, the quality of the dashboard depends on the accuracy and completeness of its source data.
4. How Dashboards Convert Raw Data into Useful Information
Raw business data consists of individual transactions and records.
For example, a company may record hundreds of sales invoices during a month.
Each invoice contains information such as customer name, product, quantity, price and transaction date.
Reviewing every invoice individually may not reveal overall performance.
A dashboard can summarise the same information.
It may show total monthly sales, product-wise revenue and customer purchase patterns.
From Data to Decision
The process generally involves five stages.
Data Collection: Obtain relevant information from authorised business systems.
Data Preparation: Validate records and organise information consistently.
Data Analysis: Calculate totals, averages, trends and comparisons.
Data Visualisation: Present results through suitable charts and tables.
Business Action: Use the findings to investigate problems or opportunities.
This process helps transform transaction records into information that management can use.
5. Why Data Visualisation Improves Business Understanding
Human beings often understand patterns more quickly when information is presented visually.
Consider a report containing twelve monthly sales figures.
A manager can read the figures individually.
However, a line chart may reveal the overall trend more clearly.
A bar chart can compare sales across product categories.
A table can provide exact values for detailed review.
A dashboard should select the presentation format according to the business question.
Common Visualisation Methods
Line Charts: Useful for understanding changes over time.
Bar Charts: Useful for comparing products, departments or periods.
Pie or Donut Charts: Can illustrate simple proportions when categories are limited.
Tables: Appropriate when exact figures are important.
KPI Cards: Highlight important totals or performance indicators.
Trend Indicators: Show increases or decreases compared with earlier periods.
Visual clarity matters more than decorative complexity.
Too many colours, charts or animations can make information harder to interpret.
6. How Tally Prime Helps Businesses Understand Financial Data
Tally Prime provides accounting and business management reports that support financial analysis.
Businesses can review recorded transactions and examine their financial position.
Balance Sheet
The Balance Sheet helps management understand assets, liabilities and capital.
Profit and Loss Account
This report presents income and expenses for a selected period.
Cash Flow Statement
Cash flow reporting helps businesses examine cash movements.
Sales Register
The Sales Register provides information about recorded sales transactions.
Purchase Register
Purchase reports support procurement and expenditure reviews.
Outstanding Receivables
Businesses can identify customer balances requiring attention.
Outstanding Payables
Supplier balances help management plan payment commitments.
Stock Summary
Inventory reports provide information about quantities and values.
Ledger Reports
Ledger statements support detailed transaction analysis.
Tally Prime also supports configurable reporting views and analysis within its available features.
For advanced custom graphical dashboards, businesses may need external reporting tools or additional development.
7. Sales Dashboards: Understanding What Drives Revenue
Sales are among the most frequently monitored business indicators.
However, total revenue alone does not explain overall performance.
A sales dashboard can help management answer important questions.
Which products generate the highest revenue?
Which customers contribute most significantly to sales?
How does this month compare with the previous month?
Are sales increasing consistently?
Important Sales Metrics
Total Sales: Revenue recorded during a selected period.
Sales Growth Rate: Percentage change in revenue between periods.
Customer-Wise Sales: Revenue generated from individual customers.
Product-Wise Sales: Performance of different products.
Sales Returns: Value of returned or reversed transactions.
Average Invoice Value: Total invoice value divided by the number of relevant invoices.
These measurements help businesses understand revenue patterns.
Tally Prime sales reports can provide relevant information for analysis.
8. Inventory Dashboards: Turning Stock Records into Better Decisions
Inventory represents a major investment for many businesses.
Maintaining too much stock can restrict working capital.
Maintaining too little stock can result in missed sales opportunities.
An inventory dashboard helps management understand stock conditions.
Stock Availability
Review available quantities.
Stock Valuation
Understand the financial value of inventory.
Product Movement
Identify products with high or low transaction activity.
Stock Ageing
Where suitable data is available, examine how long inventory has remained unsold.
Warehouse Comparisons
Review stock across locations when inventory records are configured appropriately.
Reorder Planning
Use stock information and demand estimates to support purchasing decisions.
Tally Prime provides inventory reports that can support these activities.
Some advanced calculations may require additional reporting models.
9. Cash Flow Dashboards: Understanding Where the Money Goes
A business may report profits while experiencing cash shortages.
This happens because accounting profit and available cash are not the same.
For example, credit sales may increase reported revenue without immediately generating cash receipts.
At the same time, suppliers, employees and service providers require payment.
A cash flow dashboard helps management examine these differences.
Important Cash Flow Indicators
-
Cash and bank balances.
-
Customer collections.
-
Supplier payments.
-
Operating expenses.
-
Cash inflows.
-
Cash outflows.
-
Closing cash position.
Management can use this information to plan upcoming obligations.
Tally Prime provides relevant accounting information and cash flow reporting.
Future cash flow projections require assumptions about expected receipts and payments.
10. Case Study One: A Retail Business Improves Inventory Visibility
Illustrative case study
A retail electronics business operated four stores.
Management maintained accounting and inventory records in Tally Prime.
The Challenge
The company experienced inconsistent stock availability.
Some products remained unsold for long periods, while popular items occasionally became unavailable.
Management reviewed total inventory value but did not regularly analyse product movement.
The Solution
The company introduced a structured inventory reporting dashboard.
The dashboard combined product-wise sales, stock quantities and inventory values.
Managers reviewed the information weekly.
The purchasing team also investigated slow-moving products before placing new orders.
Illustrative Results
During a three-month evaluation, management estimated a 15% reduction in the value of selected slow-moving inventory.
Employees also became more consistent in identifying products requiring replenishment.
Key Learning
Inventory information becomes more useful when businesses analyse stock movement alongside sales performance.
11. Case Study Two: A Manufacturing Company Improves Financial Reporting
Illustrative case study
A manufacturing company produced industrial components for distributors.
Its accounting team maintained detailed financial records.
The Challenge
Management depended on manually prepared monthly summaries.
Different departments submitted information at different times.
As a result, financial reviews were frequently delayed.
The Solution
The company established standard reporting definitions and introduced a management dashboard.
Tally Prime supplied relevant accounting and inventory information.
Additional operational information was incorporated through controlled reporting procedures.
Illustrative Results
Management estimated a 30% reduction in recurring report preparation time during the evaluation period.
Financial discussions became more focused because employees reviewed consistent figures.
Key Learning
Effective dashboards depend on accurate source information, standardised calculations and clearly defined reporting responsibilities.
12. How Dashboards Help Business Owners Make Faster Decisions
Dashboards can reduce the time required to identify important changes.
For example, a business owner may notice that sales have increased while profitability has declined.
Instead of reviewing every transaction immediately, management can investigate product margins, discounts and operating expenses.
Similarly, a dashboard may show that customer receivables are increasing faster than revenue.
The accounts department can then review overdue invoices and collection procedures.
A Practical Decision-Making Framework
First, identify the performance indicator that requires attention.
Second, compare it with historical information.
Third, examine the underlying transactions.
Fourth, investigate possible causes.
Fifth, select a suitable action.
Finally, monitor subsequent results.
Dashboards support this process by making important information easier to access and understand.
13. Understanding Key Performance Indicators
Key Performance Indicators, commonly called KPIs, are measurements used to evaluate business performance.
Different businesses require different indicators.
Revenue Growth
Measures changes in sales over time.
Gross Profit Margin
Indicates the proportion of revenue remaining after the cost of goods sold.
Net Profit Margin
Measures net profit relative to revenue.
Receivables Ageing
Shows how long customer balances have remained outstanding.
Inventory Turnover
Indicates how frequently inventory is sold or consumed during a period.
Operating Expense Ratio
Compares operating expenses with an appropriate revenue measure.
Working Capital
Measures current assets less current liabilities.
Cash Conversion Cycle
Examines the time required to convert inventory and other operating investments into cash.
Not every KPI should appear on every dashboard.
Businesses should select indicators that support their specific objectives.
14. Real-Time Dashboards vs Traditional Reports
Traditional reports and dashboards serve different purposes.
A detailed accounting report provides transaction-level information.
A dashboard presents selected summaries and trends.
Both can be valuable.
Traditional Reports
Traditional reports are useful for detailed verification, accounting review and audit-related activities.
Business Dashboards
Dashboards help users monitor important indicators and identify areas requiring investigation.
Real-Time Reporting
Real-time reporting reflects changes with minimal processing delay.
Scheduled Reporting
Scheduled reporting updates information at defined intervals.
Tally Prime provides access to current recorded information within its operating environment.
An external dashboard may update according to its configured integration or refresh process.
Businesses should verify the actual refresh frequency rather than assuming that all connected dashboards operate in real time.
15. How to Build a Business Dashboard Using Tally Prime Information
Businesses can begin with existing reports before investing in advanced dashboard development.
Step 1: Identify Business Questions
Determine what management needs to understand.
Step 2: Select Relevant Metrics
Choose indicators such as revenue, receivables, inventory value and profitability.
Step 3: Review Available Tally Prime Reports
Identify reports containing the required information.
Step 4: Define Reporting Periods
Establish consistent daily, weekly or monthly comparisons.
Step 5: Prepare the Data
Check accounting classifications, dates and transaction completeness.
Step 6: Select a Reporting Method
Use built-in reporting features or evaluate external dashboard solutions.
Step 7: Design Clear Visualisations
Present information using appropriate charts and tables.
Step 8: Validate Calculations
Compare dashboard results with authoritative accounting records.
Step 9: Configure Access Permissions
Ensure users can access only appropriate information.
Step 10: Review and Improve
Adjust the dashboard as business requirements change.
A gradual implementation is often more manageable than attempting to display every available metric immediately.
16. Common Mistakes Businesses Make with Dashboards
Including Too Much Information
Excessive metrics can distract users from important issues.
Ignoring Data Accuracy
Incorrect source records lead to misleading analysis.
Using Confusing Charts
Visualisations should simplify information rather than complicate it.
Comparing Inconsistent Periods
Reports should use clearly defined timeframes.
Ignoring Business Context
A change in revenue may result from seasonality, pricing or other factors.
Failing to Investigate Details
Summary figures should be supported by transaction-level review.
Neglecting Data Security
Sensitive financial information should be restricted to authorised users.
Failing to Take Action
A dashboard provides limited value if management never responds to its findings.
Businesses should treat dashboards as decision-support tools rather than automatic solutions.
17. Security and Accuracy in Business Dashboards
Financial information is sensitive.
Businesses should establish appropriate controls when creating reporting systems.
Access Control
Employees should receive permissions according to their responsibilities.
Secure Data Exchange
Information transferred between applications should use appropriate protected methods.
Data Validation
Reporting figures should be checked against source records.
Auditability
Important changes to reporting calculations should be documented.
Backup Procedures
Dashboard configurations and relevant information should be protected.
Data Refresh Monitoring
Businesses should identify failed or delayed updates.
Confidentiality
Customer and supplier information should be handled responsibly.
Reliable dashboards require both technical safeguards and sound accounting procedures.
18. Measuring the Success of Business Dashboards
A dashboard should improve business understanding and operational performance.
Organisations can evaluate its usefulness through measurable indicators.
| Indicator | Purpose |
|---|
| Report Preparation Time |
Measures reporting efficiency |
| Data Accuracy |
Evaluates consistency with accounting records |
| Dashboard Usage |
Shows whether employees use the information |
| Decision Response Time |
Measures how quickly management responds to issues |
| Receivables Ageing |
Supports collection analysis |
| Inventory Turnover |
Helps assess stock efficiency |
| Gross Profit Margin |
Supports profitability analysis |
| Cash Flow Visibility |
Helps management understand liquidity |
| Reporting Refresh Delay |
Measures information freshness |
These measurements should be interpreted together.
A dashboard that saves time but displays inaccurate information is not successful.
19. The Future of Business Dashboards and Data Analytics
Business reporting is becoming increasingly connected.
Organisations are using digital systems to combine accounting, inventory, customer and operational information.
Modern reporting tools can support interactive analysis and automated data preparation.
Cloud-based platforms may allow authorised employees to access information from different locations.
Artificial intelligence may assist with identifying unusual trends, preparing summaries and supporting forecasting.
However, AI-generated analysis requires validation.
Incorrect assumptions or incomplete records can produce misleading conclusions.
Human judgement remains essential.
For businesses using Tally Prime, the most practical approach is to maintain accurate accounting records while evaluating additional reporting capabilities according to genuine business needs.
Technology should make financial information easier to understand without weakening accounting controls.
Conclusion
Business dashboards simplify complex information by transforming accounting and operational records into understandable summaries, trends and performance indicators.
They help organisations identify important changes, monitor financial health and make more informed decisions.
Sales dashboards reveal revenue patterns.
Inventory dashboards support stock management.
Cash flow dashboards help businesses understand liquidity.
Financial dashboards provide a broader view of profitability and performance.
Tally Prime offers accounting, inventory and reporting capabilities that provide a strong foundation for business analysis.
When additional graphical reporting is required, organisations can evaluate suitable external dashboard solutions and supported integration methods.
However, successful reporting depends on accurate records, consistent calculations, appropriate security and regular management review.
The real power of a dashboard is not in the number of charts it displays. It is in its ability to turn complicated business information into clear decisions that support sustainable growth.
Powered by Binarysoft Technologies
Authorized Tally Partner
Location: 1626/33, 1st Floor, Naiwalan, Karol Bagh, New Delhi – 110005, INDIA
Contact Us: +91 7428779101, 9205471661
Email: tally@binarysoft.com
Business Hours: 10:00 AM – 6:00 PM, Monday to Friday
Binarysoft Technologies helps businesses implement Tally Prime, improve accounting workflows, manage inventory and evaluate suitable reporting solutions for stronger financial visibility and operational efficiency.
Frequently Asked Questions
Can dashboards help improve cash flow?
Dashboards can highlight receivables, payment obligations and cash flow trends, helping management plan financial activities.
What is the difference between a dashboard and a detailed report?
A dashboard presents selected summaries and indicators, while a detailed report provides more extensive information for investigation and verification.
Are business dashboards updated automatically?
Some dashboards update automatically, while others use scheduled or manual refreshes. The frequency depends on the reporting system and integration method.
What are the most important business dashboard KPIs?
Common KPIs include revenue growth, profit margins, outstanding receivables, inventory turnover, working capital and cash flow.
CA. Arinav Chakraborty advises businesses on taxation, accounting systems, and financial planning. His professional interests include digital transformation, compliance management, and improving business efficiency through technology.