Call CA Tally HelpDesk
+91 9205471661,
7428779101
Introduction: Why Monthly Financial Metrics Matter More Than Ever for MSMEs
Running a successful business requires more than increasing sales, acquiring customers and expanding operations.
Many micro, small and medium enterprises generate substantial revenue but still struggle with delayed customer payments, rising expenses, excess inventory and unpredictable cash flow.
A business may appear profitable on paper while facing difficulty paying suppliers, employees and other operating expenses.
This happens when business owners monitor sales figures but overlook the financial indicators that explain the company's actual performance.
In 2026, Indian MSMEs face growing pressure to manage working capital carefully, respond to changing customer demand and make timely financial decisions.
Monthly financial metrics provide a practical way to identify problems before they become serious.
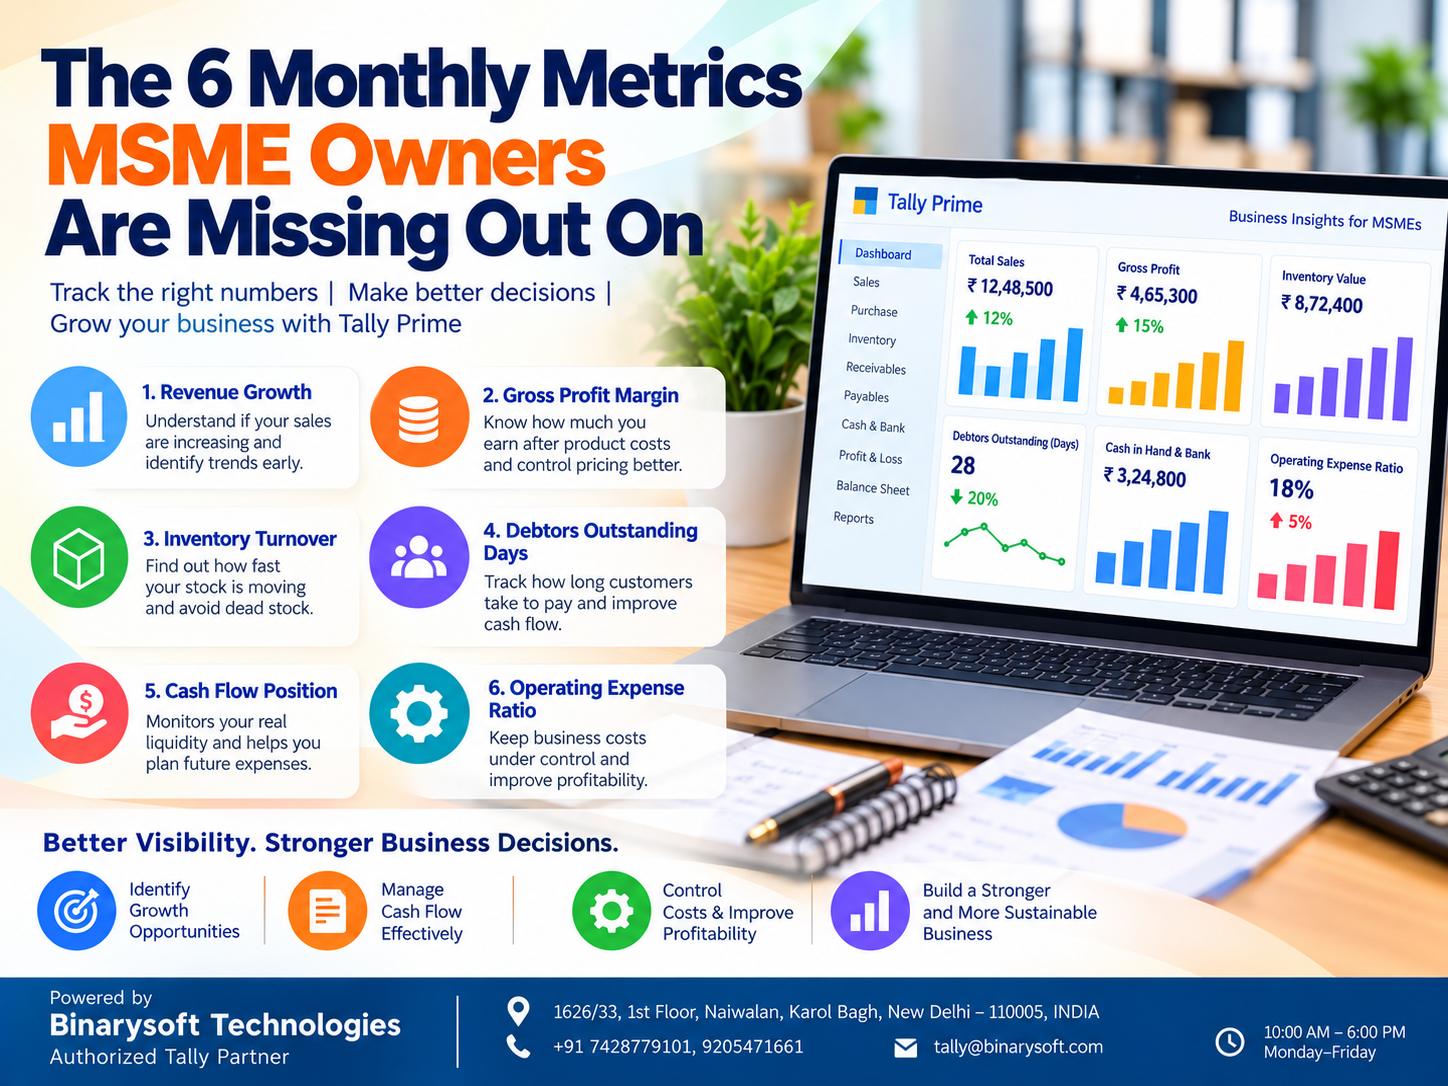
By monitoring revenue growth, gross profit margin, inventory turnover, debtor days, cash flow and operating expenses, business owners can understand where money is earned, invested, delayed or lost.
Tally Prime supports this process through accounting, inventory, receivables, cash and bank reports, and financial statements.
This guide explains six important monthly metrics, their calculations, practical applications and how they can help MSMEs achieve sustainable growth.
A Story: The Business Owner Who Was Making Sales but Running Out of Money
Rakesh operated a wholesale electrical goods business in Karol Bagh, Delhi.
For more than ten years, he supplied cables, switches, lighting equipment and electrical accessories to retailers and contractors.
His business had grown steadily.
Monthly sales had increased from approximately ₹18 lakh to ₹30 lakh, and he had recently hired additional employees to manage growing customer demand.
From the outside, everything looked successful.
However, Rakesh was worried.
Despite higher sales, his bank balance remained low.
Suppliers were calling regularly for overdue payments, while customers were requesting longer credit periods.
One evening, Rakesh sat in his office reviewing invoices and payment reminders.
He could not understand why a business generating ₹30 lakh in monthly sales was struggling to maintain sufficient cash.
His accountant suggested reviewing six financial indicators rather than focusing only on revenue.
The results were revealing.
Sales had increased, but gross profit margins had declined.
A significant amount of inventory remained unsold.
Customer payments were arriving later than expected.
Operating expenses had increased faster than revenue.
Rakesh realised that business growth and financial strength were not necessarily the same thing.
He began reviewing monthly reports in Tally Prime and introduced regular meetings with his accountant.
His team monitored overdue customers, reviewed slow-moving inventory and evaluated expenses before making major purchasing decisions.
Gradually, his business developed better financial discipline.
The most important change was not simply an increase in sales.
It was learning to understand what the numbers were saying.
A growing business needs more than revenue. It needs sufficient profit, healthy cash flow and control over the money invested in daily operations.
This is an illustrative story created to explain common financial challenges faced by Indian MSMEs.
1. Why MSME Owners Must Look Beyond Sales and Profit
Sales and net profit are important, but they do not explain every aspect of financial health.
A company may report strong profits while holding excessive inventory or waiting several months for customer payments.
Another business may have moderate sales but maintain strong liquidity, low debt and reliable cash collections.
Financial ratios help owners identify these differences.
The six particularly useful indicators are:
-
Current Ratio
-
Quick Ratio
-
Debtor Days
-
Inventory Days
-
Debt Service Coverage Ratio
-
Operating Cash Flow Ratio
These six ratios examine liquidity, working capital efficiency, borrowing capacity and cash generation.
Revenue growth, gross profit margin and operating expenses should also be monitored as supporting indicators.
2. Metric One: Current Ratio – Can Your Business Pay Its Short-Term Bills?
The current ratio measures whether a business has sufficient current assets to cover its current liabilities.
Formula:
Current Ratio = Current Assets ÷ Current Liabilities
Current assets generally include cash, bank balances, trade receivables, inventory and other assets expected to be realised within the operating cycle or twelve months.
Current liabilities include supplier dues, short-term borrowings, outstanding expenses and other obligations due within the relevant period.
Practical Example
A wholesale distributor has:
|
Particulars
|
Amount
|
|---|
|
Cash and bank
|
₹3,00,000
|
|
Trade receivables
|
₹8,00,000
|
|
Inventory
|
₹9,00,000
|
|
Total current assets
|
₹20,00,000
|
|
Current liabilities
|
₹12,00,000
|
Current Ratio = ₹20,00,000 ÷ ₹12,00,000 = 1.67
This means the business has approximately ₹1.67 in current assets for every ₹1 of current liabilities.
A ratio above 1 indicates that current assets exceed current liabilities. However, it does not guarantee immediate cash availability.
How Tally Prime Helps
Tally Prime provides balance sheet reports containing assets and liabilities.
Business owners can review relevant ledger balances and calculate the current ratio.
The ratio is particularly useful when evaluating supplier payment capacity and short-term borrowing requirements.
3. Metric Two: Quick Ratio – How Much Liquidity Is Available Without Selling Inventory?
The quick ratio measures short-term financial strength after excluding inventory and other less-liquid current assets.
It provides a more conservative liquidity assessment than the current ratio.
Formula:
Quick Ratio = Quick Assets ÷ Current Liabilities
Quick assets typically include cash, bank balances, short-term liquid investments and eligible receivables.
Practical Example
Using the previous business:
Current assets = ₹20,00,000
Inventory = ₹9,00,000
Other non-quick current assets = ₹0
Current liabilities = ₹12,00,000
Quick Ratio = (₹20,00,000 − ₹9,00,000) ÷ ₹12,00,000
Quick Ratio = 0.92
The business has approximately ₹0.92 of quick assets for every ₹1 of current liabilities.
This suggests that some short-term obligations may depend on collecting receivables, selling inventory or obtaining other funding.
Why It Matters
A company can have a satisfactory current ratio while experiencing a shortage of immediately available funds.
This is particularly important for wholesalers and manufacturers holding substantial inventory.
Tally Prime Benefits
Tally Prime's balance sheet, cash and bank reports, and outstanding receivables reports help businesses identify the components required for quick ratio calculations.
4. Metric Three: Debtor Days – How Long Do Customers Take to Pay?
Debtor Days, also called Days Sales Outstanding or DSO, measures the average time required to collect payment from credit customers.
Long collection periods can place pressure on working capital.
Formula:
Debtor Days = (Average Trade Receivables ÷ Net Credit Sales) × Number of Days
For a monthly calculation, use the number of days in that month.
Example
Average trade receivables = ₹9,00,000
Monthly net credit sales = ₹12,00,000
Period = 30 days
Debtor Days = (₹9,00,000 ÷ ₹12,00,000) × 30
Debtor Days = 22.5 days
This means the business takes approximately 23 days to collect its credit sales, on average.
Why Debtor Days Matter
Increasing debtor days may indicate delayed payments, weak credit controls or billing disputes.
If customer collections slow down, the business may need additional working capital to meet its obligations.
How Tally Prime Helps
Tally Prime supports bill-wise outstanding reports and receivables ageing analysis.
Businesses can identify overdue invoices, review customer balances and prioritise payment follow-ups.
Accurate credit sales and receivables records help make DSO calculations more meaningful.
5. Metric Four: Inventory Days – How Long Does Stock Remain Unsold?
Inventory Days, also known as Days Inventory Outstanding, measures the average number of days inventory remains in the business before being sold.
Excessive inventory days can indicate slow-moving products, inefficient purchasing or weak demand forecasting.
Formula:
Inventory Days = (Average Inventory ÷ Cost of Goods Sold) × Number of Days
Practical Example
Average inventory = ₹6,00,000
Monthly cost of goods sold = ₹4,50,000
Period = 30 days
Inventory Days = (₹6,00,000 ÷ ₹4,50,000) × 30
Inventory Days = 40 days
This means inventory remains in the business for approximately 40 days before being sold, on average.
Business Implications
Higher inventory days can increase storage costs and working capital requirements.
Very low inventory days may also create stock shortages if replenishment is unreliable.
The ideal level depends on the industry, product characteristics and supply chain.
Tally Prime Inventory Reports
Tally Prime supports stock summaries, inventory valuation and stock movement reports.
These reports help businesses identify slow-moving products and review stock quantities and values.
6. Metric Five: Debt Service Coverage Ratio – Can Your Business Repay Its Loans?
The Debt Service Coverage Ratio, or DSCR, measures the ability of a business to meet scheduled debt obligations from earnings or cash available for debt servicing.
It is particularly relevant for businesses with term loans and other scheduled repayments.
A common formulation is:
DSCR = Cash Available for Debt Service ÷ Total Scheduled Debt Service
The numerator and treatment of interest, taxes and other adjustments may vary according to the lender's methodology.
Practical Example
Annual cash available for debt service = ₹18,00,000
Annual principal and interest obligations = ₹12,00,000
DSCR = ₹18,00,000 ÷ ₹12,00,000
DSCR = 1.50
This indicates that the business generates ₹1.50 of cash available for debt service for every ₹1 of scheduled debt obligations.
Why DSCR Matters
A low DSCR may indicate that borrowing commitments are placing pressure on the business.
Banks and financial institutions may use DSCR when evaluating repayment capacity.
There is no universally acceptable DSCR threshold for every lender or loan product.
How Tally Prime Helps
Tally Prime can provide accounting information about income, expenses, interest and loan balances.
Businesses may need a separate repayment schedule and adjustments to calculate DSCR according to lender requirements.
7. Metric Six: Operating Cash Flow Ratio – Is the Business Generating Real Cash?
The Operating Cash Flow Ratio measures how effectively cash generated from normal business operations covers current liabilities.
It is useful because accounting profit and operating cash flow can differ significantly.
Formula:
Operating Cash Flow Ratio = Net Cash Flow from Operating Activities ÷ Current Liabilities
For meaningful comparisons, use consistent periods and appropriate liability balances.
Practical Example
Annual operating cash flow = ₹15,00,000
Current liabilities = ₹12,00,000
Operating Cash Flow Ratio = ₹15,00,000 ÷ ₹12,00,000
Operating Cash Flow Ratio = 1.25
This indicates that operating activities generated cash equivalent to 1.25 times the current liabilities used in the calculation.
Why This Metric Matters
A company may report strong profits while customers delay payments.
Operating cash flow helps reveal whether business activity is producing cash.
A weak operating cash flow ratio can signal collection difficulties, excess inventory or other working capital pressures.
How Tally Prime Helps
Tally Prime provides cash flow statements and financial reports that support operating cash flow analysis.
Businesses should verify the cash flow classification and relevant period before calculating the ratio.
8. Six Essential Monthly Metrics at a Glance
|
Metric
|
Main Purpose
|
Warning Signal
|
|---|
|
Current Ratio
|
Short-term solvency
|
Current liabilities exceed current assets
|
|
Quick Ratio
|
Immediate liquidity
|
Excessive dependence on inventory
|
|
Debtor Days
|
Collection efficiency
|
Customers take longer to pay
|
|
Inventory Days
|
Stock efficiency
|
Inventory remains unsold too long
|
|
DSCR
|
Debt repayment capacity
|
Insufficient cash for debt servicing
|
|
Operating Cash Flow Ratio
|
Cash generation
|
Operations produce inadequate cash
|
These metrics should be reviewed together.
For example, a business with high debtor days and low quick liquidity may have a collection problem.
A business with high inventory days and weak operating cash flow may have excessive working capital invested in stock.
9. Additional Monthly Metrics MSMEs Should Monitor
The six core ratios provide a useful financial health assessment, but business owners should also track operational performance.
Revenue Growth
Revenue growth measures the change in sales between periods.
Revenue Growth = [(Current Revenue − Previous Revenue) ÷ Previous Revenue] × 100
For example, if monthly revenue increases from ₹20 lakh to ₹24 lakh, revenue growth is 20%.
Gross Profit Margin
Gross profit margin shows the percentage of revenue remaining after the cost of goods sold.
Gross Profit Margin = (Gross Profit ÷ Net Revenue) × 100
If revenue is ₹10 lakh and cost of goods sold is ₹7 lakh, gross profit margin is 30%.
Operating Expense Ratio
This measures operating expenses relative to revenue.
Operating Expense Ratio = (Operating Expenses ÷ Net Revenue) × 100
Businesses should use a consistent definition of operating expenses and avoid double-counting costs already included in cost of goods sold.
These additional metrics help explain whether growth is profitable and whether operating costs remain under control.
10. How Tally Prime Helps MSMEs Monitor Financial Performance
Tally Prime combines accounting, inventory and reporting capabilities that support financial analysis.
Profit and Loss Reports
Businesses can review revenue, expenses and profitability.
Balance Sheet
The balance sheet helps identify assets, liabilities and capital positions.
Cash Flow Statements
Cash flow reports support the analysis of cash generated and used by business activities.
Outstanding Receivables
Bill-wise reports help businesses monitor unpaid customer invoices.
Inventory Reports
Stock summaries and valuation reports provide information for inventory analysis.
Payables Management
Supplier outstanding reports help businesses plan upcoming payments.
Tally Prime does not necessarily display all six ratios as a ready-made dashboard. Some calculations may require report exports, spreadsheet formulas or customisation.
11. Case Study One: Delhi Wholesaler Improves Working Capital Control
Illustrative case study
A wholesale electrical goods business in Delhi experienced growing sales but frequent cash shortages.
The business maintained significant inventory and offered extended credit to customers.
Challenges
Customer collections were delayed.
Slow-moving products occupied warehouse space.
Management focused mainly on monthly sales rather than liquidity.
Implementation
The business began reviewing current ratio, quick ratio, debtor days and inventory days.
Its accounting team used Tally Prime to review outstanding receivables, stock reports and financial statements.
Outcome
Management gained clearer visibility into the reasons for working capital pressure.
The business introduced more structured customer follow-ups and purchasing reviews.
This helped establish better financial discipline and reduce dependence on assumptions.
12. Case Study Two: Manufacturing MSME Strengthens Loan Repayment Planning
Illustrative case study
A manufacturing company in Faridabad operated with machinery loans and working capital borrowings.
Although the business generated accounting profits, scheduled repayments created recurring financial pressure.
Challenges
Loan obligations were not consistently compared with available cash.
Inventory purchases were sometimes planned without reviewing future repayments.
Management lacked a structured monthly financial review.
Implementation
The company began monitoring DSCR, operating cash flow and short-term liquidity.
It used Tally Prime financial statements alongside a separate loan repayment schedule.
Outcome
Management gained a clearer understanding of borrowing commitments and cash availability.
Purchasing and capital expenditure decisions were reviewed more carefully.
The case illustrates how financial ratios can support more responsible borrowing and operational planning.
13. How to Create a Monthly Financial Dashboard
MSME owners do not necessarily need expensive financial software to begin monitoring business performance.
A basic monthly dashboard can be prepared using accounting reports and spreadsheet calculations.
Monthly Financial Health Dashboard
Illustrative figures — edit your actual values and targets
Editable
Targets are illustrative, not universal financial benchmarks. Debtor Days and Inventory Days are better when lower; the other four are generally stronger when higher, subject to business context. Copy Dashboard Data
Business owners should review the dashboard at the same time every month.
This makes it easier to identify trends and determine which financial problems require immediate attention.
14. A Practical Monthly Financial Review Process
A structured monthly review can be completed in five stages.
Stage 1: Finalise Accounting Entries
Ensure purchases, sales, expenses, receipts and payments are recorded accurately.
Stage 2: Review Financial Statements
Examine the balance sheet, profit and loss statement, cash flow statement and relevant supporting reports.
Stage 3: Calculate Key Ratios
Calculate the six financial metrics using consistent periods and definitions.
Stage 4: Investigate Unusual Changes
Identify increases in debtor days, inventory days or borrowing pressure.
Stage 5: Create an Action Plan
Assign responsibilities for collection follow-ups, purchasing decisions, expense control and repayment planning.
Monthly reviews should complement more frequent cash monitoring, especially for businesses with tight liquidity.
15. How Tally on Cloud Supports Financial Monitoring
Businesses with multiple branches may benefit from centralised accounting access.
A properly configured Tally on Cloud environment can allow authorised employees to work with centrally hosted Tally Prime data.
This may help business owners and accountants review financial records from different locations.
For example, a distributor with offices in Delhi, Noida and Gurugram can maintain centralised accounting information rather than relying on separate company files.
Remote access can support timely reporting, while appropriate permissions and backup arrangements help maintain operational control.
Businesses should verify hosting performance, licensing, security and backup requirements before deployment.
16. Common Financial Monitoring Mistakes MSMEs Should Avoid
One common mistake is reviewing financial ratios only when applying for a loan.
Another is calculating ratios using incomplete or outdated accounting information.
Businesses may also compare monthly figures with annual figures without adjusting for the period.
For example, monthly operating cash flow should not be compared directly with an annual debt service figure without appropriate normalisation.
Other mistakes include ignoring overdue receivables, using inconsistent inventory valuation methods and assuming that positive accounting profit guarantees sufficient cash.
Financial metrics should be interpreted according to industry conditions, seasonality and the company's business model.
17. Building a Stronger Financial Future Through Monthly Reviews
Financial discipline becomes more valuable as businesses expand.
A small retailer may initially manage operations through personal experience.
However, as the number of products, customers, employees and suppliers increases, decisions become more complicated.
Regular financial analysis helps business owners identify emerging problems before they create serious difficulties.
It can also improve communication with accountants, lenders and business partners.
Tally Prime supports this process by providing accounting and operational reports that can be converted into meaningful performance indicators.
The objective is not to create complicated financial dashboards.
It is to understand the business well enough to make timely and responsible decisions.
Conclusion
Monitoring monthly financial metrics is one of the most practical ways for MSME owners to improve financial control.
Current ratio and quick ratio reveal short-term liquidity.
Debtor days and inventory days help explain working capital efficiency.
Debt Service Coverage Ratio measures repayment capacity, while the Operating Cash Flow Ratio shows whether business operations are generating sufficient cash.
Together, these six indicators provide a more complete picture of financial health than sales or profit figures alone.
Tally Prime helps businesses maintain the accounting, inventory, cash flow and outstanding records required for these calculations.
For manufacturers, wholesalers, retailers, distributors and service providers, regular financial reviews can improve purchasing decisions, customer credit management and borrowing discipline.
A successful business is not simply one that sells more. It is one that understands its financial position, controls its risks and generates sustainable cash flow.
Powered by Binarysoft Technologies Authorized Tally Partner
Location: 1626/33, 1st Floor, Naiwalan, Karol Bagh, New Delhi – 110005, INDIA
Contact: +91 7428779101, 9205471661
Email: tally@binarysoft.com
Business Hours: 10:00 AM – 6:00 PM, Monday–Friday
Frequently Asked Questions
What are the six important financial metrics for MSMEs?
The six important metrics are Current Ratio, Quick Ratio, Debtor Days, Inventory Days, Debt Service Coverage Ratio and Operating Cash Flow Ratio.
Why should MSMEs review financial ratios every month?
Monthly reviews help businesses identify liquidity problems, delayed customer payments, excessive inventory and debt repayment pressure before these issues become serious.
What is a good current ratio for a small business?
A current ratio above 1 indicates that current assets exceed current liabilities, but the appropriate level depends on the industry, operating cycle and quality of assets.
What is the Operating Cash Flow Ratio?
It compares operating cash flow with current liabilities to help assess the business's ability to cover short-term obligations through operating cash generation.
CA. Lakshy Vermaa advises small and mid-sized businesses on accounting discipline, tax compliance, and process improvement. With exposure to retail and trading environments, he writes practical articles aimed at helping business owners gain better financial visibility and control.