Call CA Tally HelpDesk
+91 9205471661,
7428779101
Introduction: Why Inventory Turnover Ratio Matters More Than Ever
A business can achieve impressive sales figures and still struggle financially. One common reason is excessive investment in inventory that remains unsold for weeks or months.
For retailers, wholesalers, distributors and manufacturers across India, managing inventory efficiently is essential for maintaining profitability, improving cash flow and meeting customer demand.
The inventory turnover ratio is an important financial performance indicator that helps business owners understand how efficiently their inventory is being sold and replenished.
Consider a wholesale trader who purchases products worth ₹20 lakh but sells only a small portion during the next few months. Although the business has valuable stock, much of its working capital remains blocked.
Meanwhile, another trader maintains smaller inventory quantities, replenishes stock regularly and generates consistent sales.
The second business may achieve stronger financial performance because its inventory moves faster.
This is where inventory turnover analysis becomes valuable.
With accounting and inventory management software such as TallyPrime, businesses can maintain accurate stock records, analyse inventory movement and make better purchasing decisions.
Understanding inventory turnover is not simply about calculating a financial ratio. It is about building a business that uses its resources wisely.
1. What Is Inventory Turnover Ratio?
Inventory turnover ratio is a financial metric that measures how many times a business sells and replaces its average inventory during a particular accounting period.
It indicates how efficiently a company manages its stock relative to the cost of goods sold.
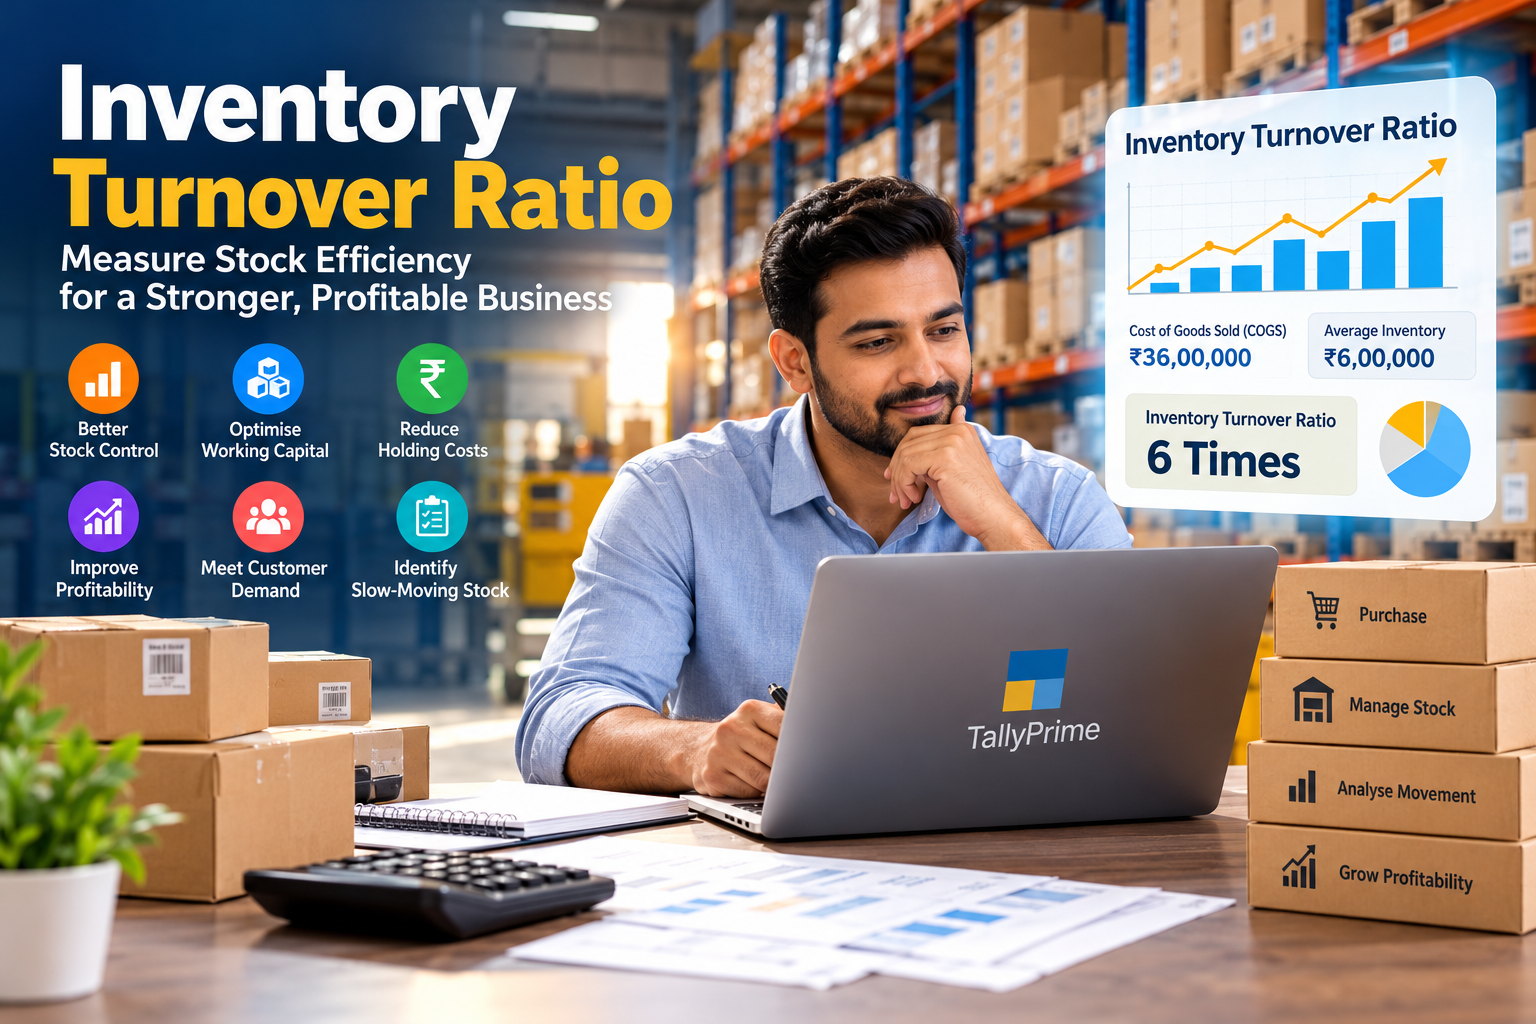
For example, if a business has an inventory turnover ratio of 6, it means the business sells inventory equivalent to its average stock investment approximately six times during the period.
A higher ratio generally indicates faster inventory movement, while a lower ratio may indicate slow sales, excessive purchasing or outdated stock.
However, an extremely high turnover ratio can also indicate insufficient inventory, increasing the risk of stock shortages.
Therefore, businesses should aim for an appropriate inventory turnover ratio based on their industry, product category and operating requirements.
Key objectives of inventory turnover analysis
-
Measure inventory management efficiency.
-
Identify slow-moving and fast-moving products.
-
Reduce unnecessary inventory investment.
-
Improve purchasing and replenishment decisions.
-
Minimise storage and carrying costs.
-
Strengthen cash flow and working capital management.
-
Reduce the risk of obsolete or expired products.
-
Maintain sufficient stock to meet customer demand.
2. Inventory Turnover Ratio Formula
The most widely used formula for calculating inventory turnover is:
Inventory Turnover Ratio
\[ \frac{\text{Cost of Goods Sold (COGS)}}{\text{Average Inventory}} \]
Where:
Cost of Goods Sold (COGS): The cost attributable to products sold during the accounting period.
Average Inventory: The average inventory value maintained during the same period.
Average inventory is commonly calculated as:
\[ \frac{\text{Opening Inventory}+\text{Closing Inventory}}{2} \]
Practical example
Suppose a trading company reports the following figures:
|
Particulars
|
Amount
|
|---|
|
Opening Inventory
|
₹5,00,000
|
|
Closing Inventory
|
₹7,00,000
|
|
Cost of Goods Sold
|
₹36,00,000
|
|
Average Inventory
|
₹6,00,000
|
Inventory Turnover Ratio = ₹36,00,000 ÷ ₹6,00,000
Calculated Inventory Turnover Ratio
6 times
The business turns over inventory equivalent to its average stock six times annually.
This calculation provides valuable information about how effectively the company converts inventory into sales.
3. Inventory Turnover Ratio Calculator
Use this interactive calculator to estimate inventory turnover and the average number of days inventory remains in stock.
Turnover Ratio
6.00×
Days in Inventory
60.8
Average Inventory: ₹6,00,000. Assumes a 365-day reporting period. Enter non-negative inventory and COGS values.Reset Example
4. Understanding Inventory Turnover Days
Inventory turnover days, also known as Days Inventory Outstanding (DIO), estimate how long inventory remains in stock before being sold.
The formula is:
\[ \text{Inventory Days}=\frac{365}{\text{Inventory Turnover Ratio}} \]
For a business with an annual turnover ratio of 6:
Inventory Days = 365 ÷ 6 = approximately 60.8 days.
This means the business holds inventory for an average of approximately 61 days.
Lower inventory days may indicate faster movement and reduced storage costs.
However, the ideal inventory holding period depends on factors such as supplier delivery schedules, product demand, seasonality and industry characteristics.
5. High Inventory Turnover vs Low Inventory Turnover
Understanding the difference between high and low inventory turnover helps business owners evaluate stock efficiency.
|
Factor
|
High Turnover
|
Low Turnover
|
|---|
|
Inventory movement
|
Faster
|
Slower
|
|
Working capital
|
Less tied up in stock
|
More tied up in stock
|
|
Storage expenses
|
Often lower
|
Often higher
|
|
Obsolescence risk
|
Generally lower
|
Generally higher
|
|
Stock shortage risk
|
May increase
|
Usually lower
|
|
Purchasing requirements
|
More frequent
|
Less frequent
|
Neither a high nor a low ratio is automatically good or bad.
For example, grocery stores may experience high inventory turnover because products sell frequently.
Furniture retailers may experience lower turnover because products are expensive and customers purchase them less frequently.
Businesses should compare inventory turnover against relevant industry benchmarks and their own historical performance.
6. Why Inventory Turnover Ratio Is Important for Indian Businesses
Better working capital management
Inventory represents money invested in products that have not yet been sold.
When stock moves slowly, businesses may struggle to pay suppliers, employees and operating expenses.
Improving inventory turnover helps release working capital for other business activities.
Reduced inventory holding costs
Excessive stock increases expenses associated with warehousing, insurance, handling, maintenance and potential product deterioration.
Efficient inventory management helps reduce these costs.
Improved purchasing decisions
Inventory turnover analysis helps purchasing teams identify which products require frequent replenishment and which products should be purchased cautiously.
Higher profitability potential
Reducing unnecessary inventory investment can improve financial efficiency.
However, businesses must also protect their profit margins and avoid excessive discounting merely to increase turnover.
Better customer satisfaction
Accurate stock planning helps businesses maintain product availability while avoiding excessive inventory.
Customers receive products on time, strengthening trust and encouraging repeat purchases.
7. An Emotional Business Story: When Unsold Stock Threatened a Family Business
For nearly twenty years, Rajesh had operated a small electrical goods shop in Delhi.
His father had started the business with limited savings, gradually building relationships with electricians, contractors and local retailers.
Rajesh believed that keeping large quantities of products was the safest way to operate.
Whenever suppliers offered discounts, he purchased additional stock.
His warehouse was filled with switches, wires, lighting accessories and electrical fittings.
But one evening, his father asked a difficult question:
“Why are our shelves full when our bank account is almost empty?”
Rajesh realised that although the shop was generating sales, thousands of products remained unsold.
Some lighting models had become outdated. Others had been replaced by newer designs.
Meanwhile, suppliers were requesting payments, and the business was struggling to maintain sufficient cash.
The problem was not simply low sales. It was poor inventory planning.
Rajesh decided to examine his inventory turnover ratio and identify products that were consuming working capital without generating adequate returns.
He began maintaining organised inventory records, reviewing stock movement and adjusting purchase quantities.
Over time, the business reduced unnecessary purchasing, cleared selected slow-moving inventory and improved product availability.
The experience changed Rajesh's approach to business.
He realised that business success was not measured by how much inventory he owned, but by how effectively that inventory supported sales and profitability.
This is an illustrative story created to explain the financial and emotional impact of inventory management challenges.
8. How TallyPrime Helps Businesses Manage Inventory Turnover
TallyPrime provides integrated accounting and inventory management capabilities that help businesses maintain stock records and analyse inventory performance.
Instead of relying entirely on manual registers or disconnected spreadsheets, businesses can record inventory transactions and examine relevant reports within the same accounting system.
8.1 Stock item management
Businesses can create individual stock items for products they purchase, manufacture or sell.
Each stock item can include information such as:
-
Product name and stock classification.
-
Unit of measurement.
-
Opening stock quantity and value.
-
Applicable inventory valuation details.
-
GST-related product information, where required.
Properly maintained stock items help businesses analyse inventory movement at the product level.
8.2 Stock groups and categories
Businesses handling hundreds or thousands of products can organise inventory into stock groups and, where useful, stock categories.
For example, an electrical goods wholesaler may create groups for wires, switches, lighting products and distribution accessories.
This classification helps management identify which product groups contribute most to sales and which require attention.
8.3 Real-time inventory updates
When inventory transactions are recorded correctly, TallyPrime updates the corresponding stock quantities.
Purchase vouchers increase inventory, while sales vouchers involving stock items generally reduce available quantities.
Stock adjustments, transfers and other inventory transactions can also be recorded using appropriate voucher types.
This helps businesses maintain more accurate inventory balances.
8.4 Stock Summary report
The Stock Summary report provides an overview of inventory quantities and values.
Business owners can review opening stock, inward movement, outward movement and closing stock.
These figures are useful when evaluating inventory efficiency and investigating unusual stock balances.
8.5 Movement Analysis
Movement Analysis reports help businesses examine inward and outward stock movement over a selected period.
Management can use these reports to identify products with significant movement and compare activity across stock items or groups.
The information supports purchasing, replenishment and inventory turnover analysis.
8.6 Ageing Analysis
Inventory ageing helps businesses understand how long products have remained in stock.
Ageing information can highlight products that require special attention because of limited movement or extended holding periods.
This is particularly useful for businesses selling electronics, fashion accessories, spare parts and products affected by changing customer preferences.
8.7 Godown and location management
Businesses operating multiple warehouses can maintain godown-wise inventory records.
For example, a distributor may store products at warehouses in Karol Bagh, Rohini and Ghaziabad.
Location-wise reporting helps management evaluate stock availability and movement across different facilities.
8.8 Inventory valuation
Inventory valuation affects the reported cost of goods sold and the inventory turnover ratio.
TallyPrime supports inventory valuation methods such as FIFO and average cost, subject to the relevant configuration and reporting requirements.
Businesses should apply suitable valuation policies consistently and consider applicable accounting requirements.
8.9 Integrated financial reporting
TallyPrime connects inventory-related transactions with accounting information.
Businesses can review financial statements and inventory reports to calculate turnover using appropriate cost and stock values.
An important distinction is that the inventory turnover ratio should be calculated using cost of goods sold, not total sales revenue, when applying the standard formula.
TallyPrime reports provide the underlying information, while the final ratio may be calculated separately if a dedicated ratio report is not available in the installed version or configuration.
9. Step-by-Step: How to Analyse Inventory Turnover Using TallyPrime
Businesses can follow a practical workflow to evaluate stock efficiency.
Step 1: Create and organise stock masters
Create relevant stock items, stock groups, units of measurement and godowns.
Ensure that opening stock quantities and values are accurate.
Step 2: Record inventory transactions
Record purchases, sales, returns and stock adjustments using appropriate vouchers.
Avoid unnecessary manual changes that could create differences between physical and recorded stock.
Step 3: Review Stock Summary
Open the Stock Summary report and select the required financial period.
Examine stock quantities, inward and outward movements, and closing inventory values.
Step 4: Determine average inventory
Obtain opening and closing inventory values for the selected period.
Calculate their average.
For businesses with substantial seasonal fluctuations, monthly or more frequent inventory balances may provide a more representative average.
Step 5: Determine cost of goods sold
Use appropriate accounting information to establish the cost of goods sold for the same period.
For a straightforward trading business, the calculation may begin with opening inventory plus net purchases and directly attributable costs, less closing inventory, with necessary adjustments.
Step 6: Calculate inventory turnover
Divide cost of goods sold by average inventory.
Step 7: Review stock movement and ageing
Examine inventory movement and ageing reports to identify products requiring corrective action.
Step 8: Take corrective measures
Adjust purchase quantities, review reorder levels, negotiate supplier schedules and plan suitable promotions for slow-moving products.
Repeat the analysis monthly or quarterly to measure progress.
10. Case Study One: Wholesale Electrical Distributor Improves Inventory Efficiency
Illustrative case study based on a hypothetical Delhi wholesale business.
A wholesale electrical distributor operating in Bhagirath Palace maintained a large inventory of wires, switches, LED lights and electrical accessories.
The business experienced frequent cash shortages despite recording consistent sales.
Management discovered that several product categories had remained in storage for extended periods.
Initial financial position
|
Particulars
|
Before Improvement
|
|---|
|
Annual COGS
|
₹1,20,00,000
|
|
Average Inventory
|
₹40,00,000
|
|
Inventory Turnover
|
3 times
|
|
Average Inventory Days
|
121.7 days
|
The business was holding inventory for approximately four months on average.
Corrective measures
Management reorganised stock records, examined product movement and identified slow-moving items.
Purchasing quantities were reduced for products with weak demand.
Frequently sold products were replenished according to expected customer requirements.
Stock valuation and warehouse balances were reviewed regularly.
Illustrative results
|
Particulars
|
After Improvement
|
|---|
|
Annual COGS
|
₹1,20,00,000
|
|
Average Inventory
|
₹24,00,000
|
|
Inventory Turnover
|
5 times
|
|
Average Inventory Days
|
73 days
|
Inventory turnover improvement
Illustrative annual inventory turnover, before and after stock optimisation.
The hypothetical improvement reduced average inventory investment by ₹16 lakh while maintaining the same annual cost of goods sold.
This does not automatically mean ₹16 lakh in profit. Instead, it represents a reduction in capital tied up in average inventory, potentially improving liquidity and reducing financing requirements.
Role of TallyPrime
TallyPrime can support such improvements through stock classification, movement reporting, ageing analysis and integrated accounting information.
The key lesson is that inventory optimisation can improve financial flexibility without requiring a proportionate increase in sales.
11. Case Study Two: Garment Retailer Reduces Seasonal Stock Problems
Illustrative case study based on a hypothetical retail garment business.
A garment retailer operating in Lajpat Nagar sold casual wear, winter clothing and festive collections.
The business faced a recurring problem: seasonal products remained unsold after customer demand declined.
During festive periods, popular products sometimes became unavailable, while older collections occupied valuable storage space.
Initial performance
|
Particulars
|
Before Improvement
|
|---|
|
Annual COGS
|
₹60,00,000
|
|
Average Inventory
|
₹20,00,000
|
|
Inventory Turnover
|
3 times
|
|
Inventory Days
|
121.7 days
|
Management decided to improve purchasing decisions by examining stock movement more frequently.
Inventory improvement strategy
Products were organised into categories according to season, style and demand.
Management reviewed ageing information to identify collections that had remained unsold.
Smaller purchase quantities were introduced for uncertain fashion trends.
Replenishment was prioritised for frequently purchased sizes and designs.
Illustrative results
After implementing better stock planning, average inventory decreased to ₹12 lakh while annual cost of goods sold remained ₹60 lakh.
The inventory turnover ratio increased to:
₹60,00,000 ÷ ₹12,00,000 = 5 times.
Average inventory days decreased to approximately 73 days.
The business reduced average inventory investment by ₹8 lakh.
More importantly, management developed a clearer understanding of product demand and seasonal purchasing requirements.
How TallyPrime supports garment inventory
Stock groups and categories can help organise clothing products.
Inventory movement reports can support demand analysis.
Godown-wise records can help monitor stock across stores and storage locations.
Batch-related functionality, where appropriately configured, may also support selected product-tracking requirements.
The case demonstrates how inventory analysis can support better decisions in seasonal retail businesses.
12. Common Reasons for Low Inventory Turnover
Several operational problems can reduce inventory turnover and affect business profitability.
Inaccurate demand forecasting
Purchasing products without understanding customer demand can lead to excessive inventory accumulation.
Businesses should review historical sales, seasonal trends and customer preferences before placing large orders.
Excessive bulk purchasing
Supplier discounts may encourage businesses to purchase more products than necessary.
However, the savings achieved through discounts may be offset by storage costs, financing expenses and unsold inventory.
Poor product classification
When inventory records are disorganised, management may struggle to distinguish profitable, frequently sold products from slow-moving items.
Outdated inventory
Technology products, fashion merchandise and certain consumer goods can lose market relevance quickly.
Regular ageing analysis helps identify products that require attention.
Inefficient replenishment
Purchasing too early increases stockholding costs, while purchasing too late can result in lost sales.
Businesses should establish appropriate reorder quantities and supplier delivery schedules.
13. Practical Strategies to Improve Inventory Turnover
Businesses can improve inventory turnover by combining accurate inventory records with disciplined purchasing and sales planning.
ABC inventory analysis: Classify products according to their relative financial importance. High-value products generally require closer monitoring and stronger inventory controls.
Demand-based purchasing: Use historical sales and expected demand to determine appropriate purchasing quantities.
Inventory ageing reviews: Identify slow-moving and obsolete products before they become significant financial burdens.
Supplier coordination: Negotiate smaller and more frequent deliveries where commercially practical.
Reorder-level planning: Establish appropriate minimum stock levels based on expected demand, lead time and safety-stock requirements.
Product profitability analysis: Evaluate inventory turnover alongside gross profit margins to avoid sacrificing profitability for faster stock movement.
Regular physical verification: Compare physical inventory with recorded quantities and investigate significant differences.
TallyPrime can support these strategies through stock records, movement analysis, reorder-related features and inventory reporting, depending on the business configuration.
14. Inventory Turnover Ratio vs Inventory Holding Period
Although these metrics are closely related, they measure inventory efficiency differently.
|
Metric
|
Inventory Turnover Ratio
|
Inventory Holding Period
|
|---|
|
Measures
|
Frequency of inventory turnover
|
Average days inventory remains in stock
|
|
Formula
|
COGS ÷ Average Inventory
|
365 ÷ Turnover
|
|
Unit
|
Times per year
|
Days
|
|
Common objective
|
Improve stock movement
|
Reduce unnecessary holding time
|
Businesses should use both indicators to understand inventory efficiency.
For example, increasing annual inventory turnover from 4 to 6 times reduces the implied average inventory holding period from approximately 91 days to 61 days.
15. Conclusion
Inventory turnover ratio is an essential financial indicator for businesses seeking better stock management, stronger cash flow and improved operational efficiency.
By understanding how frequently inventory is sold and replenished, businesses can identify unnecessary stock investment, improve purchasing decisions and reduce storage expenses.
However, inventory turnover should never be evaluated in isolation. Businesses must also consider profitability, product availability, seasonal demand and customer satisfaction.
TallyPrime helps businesses maintain organised inventory records, analyse stock movement, monitor inventory values and connect inventory information with accounting reports.
Whether operating a retail shop, wholesale distribution business or manufacturing enterprise, regularly reviewing inventory turnover can support more informed financial decisions.
The ultimate goal is not simply to sell inventory faster. It is to maintain the right products, in the right quantities, at the right time, while protecting profitability and customer relationships.
Powered by Binarysoft Technologies Authorized Tally Partner
Location: 1626/33, 1st Floor, Naiwalan, Karol Bagh, New Delhi – 110005, INDIA
Contact us: +91 7428779101, 9205471661
Email us: tally@binarysoft.com
Business Hours: 10:00 AM – 6:00 PM, Monday–Friday
Frequently Asked Questions
Can improving inventory turnover increase profitability?
Improving inventory turnover can reduce storage costs, financing requirements and inventory obsolescence. However, businesses must also consider gross margins, purchasing costs and product availability.
Improving inventory turnover can reduce storage costs, financing requirements and inventory obsolescence. However, businesses must also consider gross margins, purchasing costs and product availability.
Yes. Small businesses often operate with limited working capital. Effective inventory turnover management can help reduce unnecessary stock investment, improve liquidity and support sustainable business growth.
What is the difference between inventory turnover and stock ageing?
Inventory turnover measures how frequently inventory is sold relative to average inventory investment. Stock ageing examines how long inventory has remained in stock.
Can TallyPrime identify slow-moving inventory?
TallyPrime provides inventory movement and ageing-related reporting capabilities that can help identify products with limited movement or extended holding periods, subject to the relevant setup and version.
CA. Shaurya Venkataraman specializes in business accounting, GST consultancy, and financial analysis. His articles focus on simplifying complex financial concepts and helping businesses improve operational efficiency.