Call CA Tally HelpDesk
+91 9205471661,
7428779101
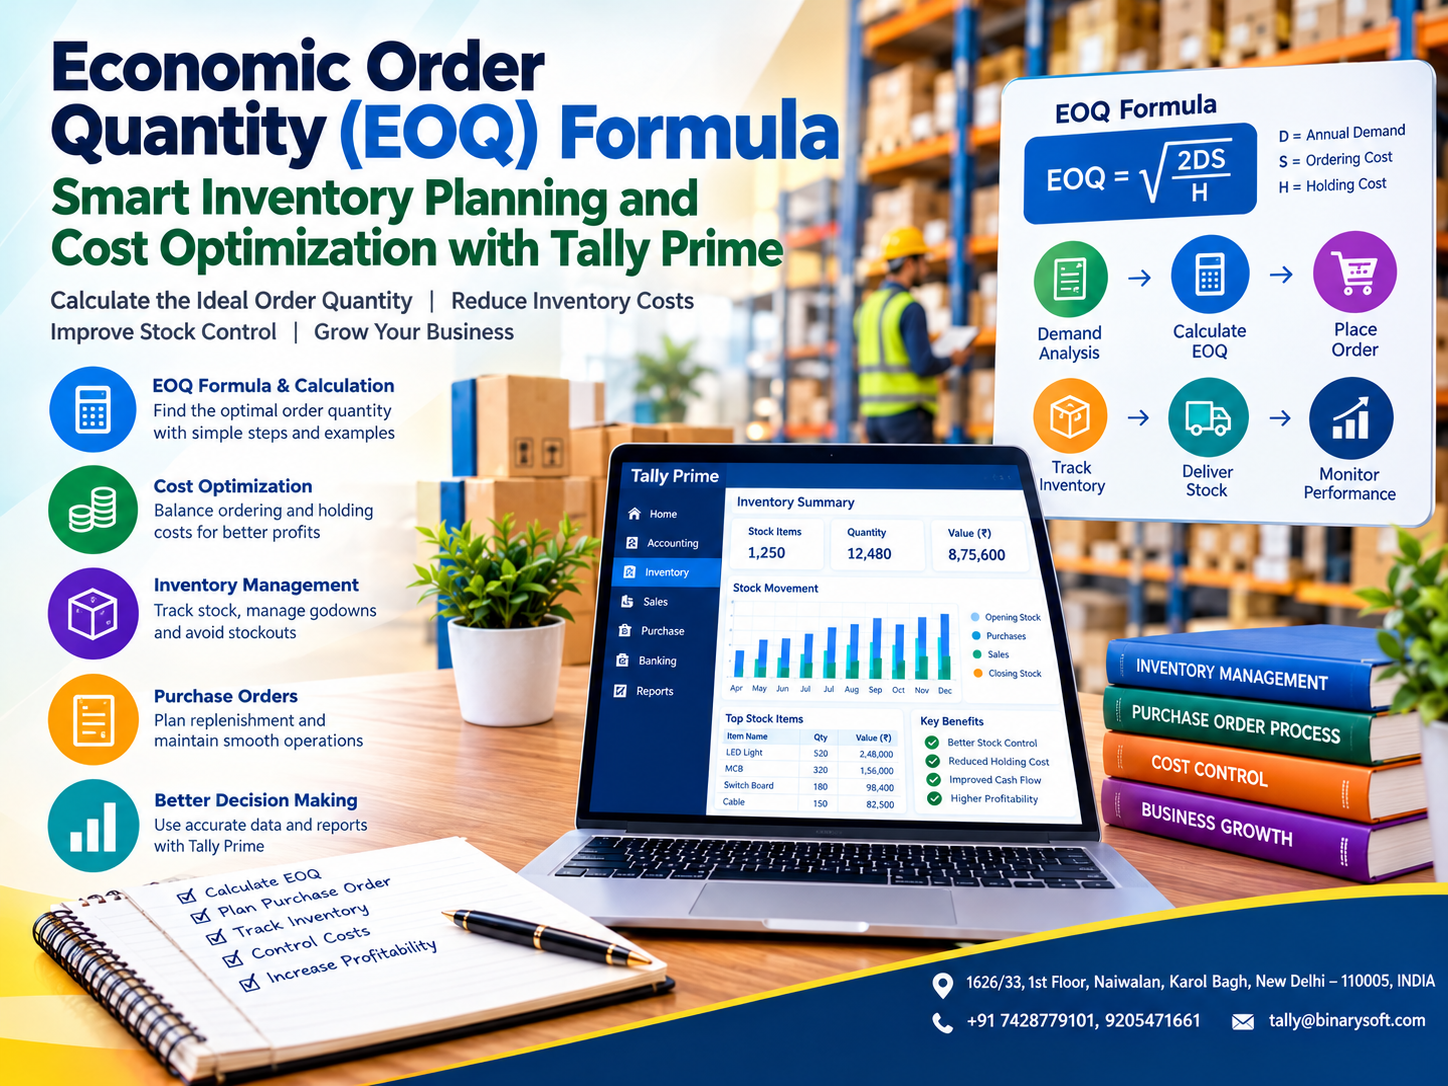
Introduction: Why Economic Order Quantity Matters for Businesses in 2026
Every business that purchases, stores or sells physical products faces an important question: how much inventory should be ordered at one time?
Ordering too much inventory can block working capital, increase warehouse expenses and create the risk of damaged or obsolete products. Ordering too little may result in frequent purchasing, higher transportation costs and stock shortages.
In 2026, Indian retailers, wholesalers, manufacturers and distributors face increasing pressure to manage inventory efficiently while maintaining reliable product availability. Changing customer demand, fluctuating supplier prices and rising operating expenses make inventory planning particularly important.
Economic Order Quantity, commonly known as EOQ, provides a mathematical approach to determining an order quantity that minimizes the combined costs of ordering and holding inventory under specified assumptions.
By understanding the EOQ formula, businesses can make more informed purchasing decisions instead of relying entirely on estimates.
When combined with inventory-management software such as Tally Prime, EOQ calculations can support better purchasing schedules, stock monitoring, financial planning and operational control.
This guide explains the EOQ formula, its components, calculation methods, advantages, limitations and practical applications for Indian businesses.
1. What Is Economic Order Quantity (EOQ)?
Economic Order Quantity is an inventory-management technique used to calculate the order quantity that minimizes the combined annual ordering and inventory holding costs.
The concept helps businesses balance two competing expenses.
Ordering frequently in small quantities generally increases ordering costs. Purchasing large quantities less frequently generally increases inventory holding costs.
EOQ identifies a balance between these costs.
For example, an electrical goods distributor purchasing switches from a supplier must decide whether to order 100, 500 or 1,000 units at a time.
Ordering 100 units may require frequent purchase orders and transportation arrangements.
Ordering 1,000 units may reduce purchasing frequency but increase storage requirements and capital tied up in inventory.
EOQ provides a structured method for evaluating the trade-off.
The basic model assumes reasonably stable demand, constant ordering and holding costs, predictable replenishment and no quantity discounts.
2. An Emotional Business Story: When Excess Inventory Threatened a Family Business
Vikram operated a wholesale hardware business in Delhi's Sadar Bazar market.
His father had established the business many years earlier, and Vikram wanted to expand it while maintaining the family's reputation.
As sales increased, he began purchasing larger quantities from suppliers.
He believed bulk purchases would protect the business against shortages and help secure better prices.
Initially, the strategy appeared successful.
However, after several months, the warehouse became crowded with products that were selling slowly.
Money remained tied up in inventory while supplier payments continued to arrive.
One afternoon, Vikram received a call from an important supplier requesting payment of an overdue invoice.
Although his warehouse contained goods worth several lakhs, his bank balance was insufficient to settle the amount comfortably.
That evening, he reviewed his purchasing decisions and realized that he had been ordering based on intuition rather than actual demand.
With assistance from his accountant, he began examining annual sales quantities, purchasing costs and inventory carrying expenses.
He learned about Economic Order Quantity and started using it as a reference for purchase planning.
His team also improved inventory recording through Tally Prime, reviewing stock movement and identifying slow-moving items.
Gradually, purchasing became more systematic.
Vikram no longer measured business strength by how full his warehouse appeared.
He began measuring it through inventory efficiency, customer service and financial stability.
This is an illustrative story demonstrating the importance of inventory planning.
3. Understanding the EOQ Formula
The classical EOQ formula calculates an order quantity using annual demand, ordering cost per order and annual holding cost per unit.
Ordering cost
Holding cost
Total cost
1002003004005006007008009002000400060008000Order quantity$/yrQ*
\(Q^*=\sqrt{\frac{2DS}{H}}=\sqrt{\frac{2(3500)(120)}{12}}=265\)
Ordering cost = holding cost = $1,587/yr
Give feedback
Where:
-
D = Annual demand: Total units required during one year.
-
S = Ordering cost: Cost incurred each time an order is placed.
-
H = Annual holding cost per unit: Cost of holding one unit in inventory for one year.
-
EOQ = Optimal order quantity: The calculated quantity that minimizes the combined annual ordering and holding costs under the model's assumptions.
The formula uses the square root of twice annual demand multiplied by ordering cost, divided by annual holding cost per unit.
It is important to use consistent time periods and monetary units.
For example, if demand is measured annually, the holding cost should also be expressed on an annual basis.
4. Step-by-Step EOQ Calculation with a Practical Example
Suppose a wholesale distributor sells electrical switches throughout the year.
The company has the following information:
|
Particulars
|
Value
|
|---|
|
Annual demand (D)
|
12,000 units
|
|
Ordering cost per order (S)
|
₹500
|
|
Annual holding cost per unit (H)
|
₹20
|
Step 1: Identify annual demand
The business requires 12,000 units annually.
Step 2: Determine ordering cost
Each purchase order costs ₹500 in relevant processing and ordering expenses.
Step 3: Determine annual holding cost
The company estimates that storing one unit costs ₹20 annually.
Step 4: Apply the EOQ formula
\[ EOQ=\sqrt{\frac{2\times12,000\times500}{20}} \]
\[ EOQ=\sqrt{600,000} \]
\[ \boxed{EOQ\approx775\text{ units}} \]
The calculated Economic Order Quantity is approximately 775 units per order.
Step 5: Calculate ordering frequency
Annual orders = 12,000 ÷ 775 = approximately 15.5 orders.
The business can use this result to plan roughly 15–16 replenishment orders annually, adjusting for practical constraints.
5. Understanding Ordering Costs
Ordering costs are expenses associated with placing and receiving inventory orders.
These costs may arise each time the business purchases goods.
Common ordering cost components
Purchase order processing: Administrative work involved in preparing and approving purchase orders.
Supplier communication: Time and resources spent coordinating purchases.
Transportation arrangements: Fixed freight or shipment-related costs associated with each order.
Receiving and inspection: Costs of checking delivered goods.
Documentation: Expenses related to purchase records and processing.
Not every purchasing expense should automatically be treated as an ordering cost.
For EOQ calculations, the focus is on relevant costs that vary with the number of orders.
Accurate ordering-cost estimates help businesses calculate more meaningful EOQ values.
6. Understanding Inventory Holding Costs
Holding costs represent the expenses associated with keeping inventory in storage.
These expenses generally increase when businesses maintain larger average inventory quantities.
Important holding cost components
Warehouse expenses: Storage space and related operating costs.
Insurance: Relevant costs associated with protecting stored goods.
Inventory financing: The opportunity or financing cost of capital invested in inventory.
Handling and maintenance: Expenses required to manage stored products.
Damage and deterioration: Expected losses from product damage or reduced condition.
Obsolescence: Risk that products become outdated or difficult to sell.
Example of holding cost
Suppose a product costs ₹200 per unit, and the estimated annual holding cost is 15% of its value.
Annual holding cost per unit:
₹200 × 15% = ₹30.
Therefore, H = ₹30 per unit annually.
The holding-cost percentage should be based on reasonable business estimates rather than selected arbitrarily.
7. Why EOQ Helps Reduce Inventory Costs
EOQ balances ordering costs and holding costs.
When a business places many small orders, its average inventory may remain low, but purchasing-related expenses increase.
When a business places fewer large orders, ordering expenses decrease, but average inventory and holding costs rise.
The EOQ model identifies the point where the combined annual cost is minimized.
Under the classical assumptions, annual ordering cost and annual holding cost are equal at EOQ.
This relationship provides a useful check when reviewing calculations.
However, EOQ does not automatically minimize every inventory-related expense.
Purchase-price discounts, stockout costs, demand uncertainty and supplier restrictions may require additional analysis.
8. EOQ and Reorder Level: Understanding the Difference
EOQ and reorder level are related but answer different questions.
EOQ answers: How much inventory should the business order?
Reorder level answers: When should the business place the next order?
The basic reorder point formula is:
\[ \text{Reorder Point}=\text{Demand During Lead Time}+\text{Safety Stock} \]
Example
A distributor sells an average of 40 units daily.
The supplier takes five days to deliver.
The business maintains safety stock of 50 units.
Reorder point:
(40 × 5) + 50 = 250 units.
When the relevant inventory position reaches 250 units, the business should consider placing a replenishment order.
EOQ can help determine the order quantity, while reorder-point calculations help determine ordering timing.
Together, these techniques support more systematic inventory planning.
9. How Tally Prime Helps with EOQ-Based Inventory Planning
Tally Prime supports inventory recording and reporting that can provide useful information for EOQ calculations.
Businesses can use stock and sales data to estimate product demand, review purchasing activity and monitor inventory balances.
Stock Summary
The Stock Summary provides information about stock quantities and values.
Businesses can review stock movement and identify items requiring attention.
Sales analysis
Historical sales information can help estimate annual demand for individual products.
Purchase order management
Tally Prime supports Purchase Orders that can be used to document planned purchases.
Reorder levels
Relevant stock-item configurations and reorder-related reporting can support replenishment monitoring.
Godown management
Businesses can track stock across different locations.
Inventory reporting
Stock reports can help identify slow-moving products and evaluate purchasing requirements.
Important: Tally Prime should not be assumed to calculate the classical EOQ formula automatically as a standard feature. Businesses may calculate EOQ separately using a spreadsheet or a suitable customized solution and then apply the result to purchasing decisions.
10. Practical EOQ Implementation Using Tally Prime
Businesses can establish an EOQ-based purchasing process using inventory information maintained in Tally Prime.
Step 1: Create stock items
Organize products with appropriate names, groups and units of measurement.
Step 2: Record purchases and sales
Maintain accurate transaction records to support demand analysis.
Step 3: Estimate annual demand
Review historical sales quantities and adjust for expected changes.
Step 4: Calculate ordering costs
Identify relevant expenses incurred per purchase order.
Step 5: Estimate holding costs
Calculate the annual cost of carrying one unit of inventory.
Step 6: Calculate EOQ
Use the EOQ formula in a spreadsheet or suitable calculation tool.
Step 7: Review practical constraints
Consider supplier minimum-order quantities, packaging sizes, storage capacity and delivery schedules.
Step 8: Create Purchase Orders
Use Tally Prime to record approved purchase orders.
Step 9: Monitor inventory
Review stock reports and replenishment requirements.
Step 10: Recalculate periodically
Update EOQ estimates when demand, ordering costs or holding costs change.
11. Case Study One: An Electrical Distributor Reduces Excess Purchasing
Illustrative case study
An electrical distributor in Delhi supplied switches, cables and lighting accessories to retail customers.
The company frequently purchased large quantities to avoid stock shortages.
The challenge
Warehouse space became increasingly limited, while some products remained unsold for long periods.
Management had difficulty determining suitable purchase quantities.
The solution
The distributor analyzed annual sales quantities and estimated ordering and holding costs.
EOQ calculations were introduced for frequently purchased products.
Tally Prime inventory reports were used to review stock quantities, sales activity and purchase requirements.
The outcome
The business developed a more structured purchasing process.
Management could evaluate order quantities using cost information instead of relying entirely on estimates.
The company also gained better visibility into slow-moving inventory.
The case demonstrates how EOQ analysis and reliable inventory records can support purchasing discipline.
12. Case Study Two: A Manufacturing Business Improves Raw-Material Planning
Illustrative case study
A small manufacturing company in Faridabad purchased packaging materials and components from multiple suppliers.
Raw-material availability was important for maintaining production schedules.
The challenge
Frequent emergency purchases increased procurement effort and transportation expenses.
At the same time, excessive purchases of some materials created storage difficulties.
The solution
The company reviewed annual material consumption, supplier lead times and purchasing costs.
EOQ calculations were used for selected materials with reasonably stable demand.
Tally Prime supported stock recording, purchase transactions and inventory monitoring.
The outcome
Management gained a clearer framework for deciding purchase quantities and replenishment timing.
The company also improved coordination between purchasing and production teams.
The example highlights how EOQ can support raw-material planning when combined with accurate inventory information.
13. Advantages of Economic Order Quantity
EOQ provides several potential benefits for businesses managing physical inventory.
Lower combined inventory costs: It identifies a cost-efficient order quantity under the model's assumptions.
Better purchasing decisions: Managers can evaluate order sizes using relevant cost information.
Improved working capital planning: More disciplined purchasing can help reduce unnecessary inventory accumulation.
Reduced ordering frequency uncertainty: EOQ provides a reference for planning replenishment cycles.
Better warehouse utilization: Appropriate order quantities can support more efficient storage.
Improved financial visibility: Businesses gain a clearer understanding of ordering and holding expenses.
More consistent inventory policies: EOQ can provide a repeatable method for selected stock items.
The actual benefits depend on demand accuracy, cost estimates and practical implementation.
14. Limitations of the EOQ Formula
Although EOQ is useful, the basic formula relies on simplifying assumptions.
Constant demand
Actual customer demand may fluctuate because of seasonal changes, market conditions or unexpected events.
Stable costs
Ordering and holding costs may change over time.
Predictable replenishment
Supplier delays can affect stock availability.
No quantity discounts
The basic formula does not account for suppliers offering lower prices on larger purchases.
Limited stockout consideration
The classical model generally assumes replenishment occurs without shortages.
Product-specific differences
Perishable, seasonal and rapidly changing products may require more sophisticated inventory policies.
Businesses should therefore use EOQ as a decision-support tool rather than an inflexible purchasing rule.
15. EOQ for Retailers, Wholesalers and Manufacturers
Different industries can apply EOQ in different ways.
Retail businesses
Retailers may use EOQ for frequently sold products with reasonably stable demand.
Wholesale distributors
Wholesalers can apply EOQ to products purchased repeatedly from established suppliers.
Manufacturing businesses
Manufacturers may use EOQ for raw materials, packaging materials and standard components.
Electronics distributors
EOQ may support purchasing decisions, but product obsolescence and changing technology should be considered.
Pharmaceutical businesses
Inventory planning must account for expiry dates, batch requirements and regulatory obligations.
EOQ is generally most useful when demand and relevant costs can be estimated with reasonable reliability.
16. Using EOQ with ABC Inventory Analysis
ABC analysis classifies inventory according to its relative importance, commonly using annual consumption value.
Category A: High-value items requiring close monitoring.
Category B: Moderately important items requiring regular review.
Category C: Lower-value items that may be managed through simpler procedures.
EOQ can be combined with ABC analysis to develop differentiated purchasing policies.
For example, a distributor may calculate EOQ carefully for high-value items while applying simpler replenishment rules to low-value products.
However, classification should also consider operational criticality, supply risk and customer requirements.
An inexpensive component can still be essential for production.
17. How EOQ Supports Cash Flow Management
Inventory represents money invested in products that may not yet have been sold.
Excessive purchasing can reduce the cash available for supplier payments, salaries and operating expenses.
EOQ provides a framework for evaluating how much inventory should be purchased at one time.
By avoiding unnecessarily large orders, businesses may reduce capital tied up in stock.
However, the smallest order quantity is not always the most economical.
Frequent small purchases may increase ordering expenses and create supply risks.
Effective cash flow management therefore requires balancing inventory costs, supplier terms, customer demand and operational needs.
Tally Prime can support this process through purchase accounting, inventory reports, outstanding balances and financial statements.
18. Best Practices for EOQ-Based Inventory Management
Businesses should review EOQ calculations regularly rather than treating them as permanent values.
Demand estimates should reflect recent sales trends and expected changes.
Ordering and holding costs should be reviewed whenever transportation, storage or financing expenses change materially.
Management should also consider supplier reliability, minimum-order quantities and product shelf life.
Inventory records must remain accurate because unreliable demand and stock information can produce misleading purchasing recommendations.
Businesses should periodically compare calculated EOQ quantities with actual purchasing experience.
Where EOQ does not produce satisfactory results, alternative inventory policies may be more appropriate.
19. Future of Inventory Optimization and EOQ
Inventory planning is becoming more data-driven as businesses adopt digital accounting systems, inventory software and automated reporting.
Historical sales information can help businesses identify demand patterns and purchasing requirements.
More advanced forecasting methods may also incorporate seasonality, supplier performance and changing customer behaviour.
However, the classical EOQ formula remains useful because it explains the fundamental relationship between ordering and holding costs.
For many small and medium businesses, a carefully maintained EOQ spreadsheet combined with reliable Tally Prime inventory data may provide a practical starting point.
The objective is not to purchase the largest quantity or maintain the lowest possible stock.
It is to maintain inventory at a level that supports customer demand while controlling relevant business costs.
Conclusion
Economic Order Quantity is an important inventory-management concept that helps businesses determine cost-efficient purchasing quantities.
By balancing ordering costs and holding costs, EOQ provides a structured method for evaluating inventory decisions.
For Indian retailers, wholesalers, manufacturers and distributors, EOQ can support purchasing discipline, working capital management and warehouse efficiency.
Tally Prime helps businesses maintain stock records, review sales and purchase activity, manage Purchase Orders and monitor inventory across locations.
Although the classical EOQ calculation may require a separate spreadsheet or customized tool, Tally Prime can provide much of the operational information needed to support the analysis.
Businesses that combine accurate inventory records, realistic cost estimates and regular purchasing reviews can make better-informed decisions and build more resilient operations.
Powered by Binarysoft Technologies
Authorized Tally Partner
Location: 1626/33, 1st Floor, Naiwalan, Karol Bagh, New Delhi – 110005, INDIA
Contact Us: +91 7428779101, 9205471661
Email: tally@binarysoft.com
Business Hours: 10:00 AM – 6:00 PM, Monday to Friday
Frequently Asked Questions
How can Binarysoft Technologies help with inventory optimization?
Binarysoft Technologies can assist businesses with Tally Prime inventory configuration, stock reporting, Purchase Order management, godown tracking, employee training and suitable inventory-management workflows.
Is EOQ suitable for every business?
EOQ is most useful when demand, ordering costs and holding costs can be estimated reasonably well. Businesses with highly uncertain demand, perishable goods or complex supplier discounts may require additional methods.
What are ordering costs in EOQ?
Ordering costs are relevant expenses incurred each time an inventory order is placed, such as processing, coordination and certain shipment-related costs.
What are holding costs in EOQ?
Holding costs include relevant expenses associated with storing inventory, such as warehousing, insurance, financing, handling and expected deterioration.
CA. Aaryan Kanodia focuses on GST reporting, bookkeeping systems, and financial process improvement. He works with businesses to simplify routine accounting activities and maintain records suitable for compliance and internal review.